## Line Chart: Performance Comparison of Mistral-7B Models
### Overview
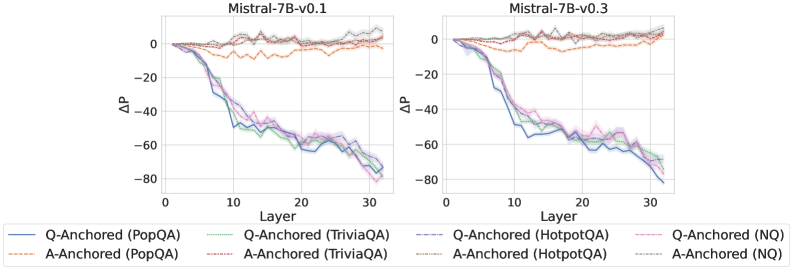
The image presents two line charts comparing the performance of Mistral-7B-v0.1 and Mistral-7B-v0.3 models across different question-answering tasks. The charts depict the change in performance (ΔP) as a function of the layer number in the model. Each chart contains six data series, representing different question-answering datasets anchored either by question (Q-Anchored) or answer (A-Anchored).
### Components/Axes
* **Titles:**
* Left Chart: "Mistral-7B-v0.1"
* Right Chart: "Mistral-7B-v0.3"
* **Y-Axis:**
* Label: "ΔP" (Change in Performance)
* Scale: -80 to 0, with increments of 20 (-80, -60, -40, -20, 0)
* **X-Axis:**
* Label: "Layer"
* Scale: 0 to 30, with increments of 10 (0, 10, 20, 30)
* **Legend:** Located at the bottom of the image, spanning both charts.
* **Q-Anchored (PopQA):** Solid blue line
* **A-Anchored (PopQA):** Dashed orange line
* **Q-Anchored (TriviaQA):** Dotted green line
* **A-Anchored (TriviaQA):** Dashed and dotted gray line
* **Q-Anchored (HotpotQA):** Dashed pink line
* **A-Anchored (HotpotQA):** Dotted gray line
* **Q-Anchored (NQ):** Dashed and dotted purple line
* **A-Anchored (NQ):** Dotted gray line
### Detailed Analysis
**Left Chart (Mistral-7B-v0.1):**
* **Q-Anchored (PopQA):** (Solid blue line) Starts at approximately 0, decreases sharply until layer 10 (reaching approximately -40), then continues to decrease gradually, reaching approximately -70 to -80 at layer 30.
* **A-Anchored (PopQA):** (Dashed orange line) Starts at approximately 0, decreases slightly, then fluctuates around -5 to 0 throughout the layers.
* **Q-Anchored (TriviaQA):** (Dotted green line) Starts at approximately 0, decreases sharply until layer 10 (reaching approximately -40), then continues to decrease gradually, reaching approximately -60 to -70 at layer 30.
* **A-Anchored (TriviaQA):** (Dashed and dotted gray line) Starts at approximately 0, fluctuates around 0 to 5 throughout the layers.
* **Q-Anchored (HotpotQA):** (Dashed pink line) Starts at approximately 0, decreases sharply until layer 10 (reaching approximately -40), then continues to decrease gradually, reaching approximately -70 to -80 at layer 30.
* **A-Anchored (HotpotQA):** (Dotted gray line) Starts at approximately 0, fluctuates around 0 to 5 throughout the layers.
* **Q-Anchored (NQ):** (Dashed and dotted purple line) Starts at approximately 0, decreases sharply until layer 10 (reaching approximately -40), then continues to decrease gradually, reaching approximately -70 to -80 at layer 30.
* **A-Anchored (NQ):** (Dotted gray line) Starts at approximately 0, fluctuates around 0 to 5 throughout the layers.
**Right Chart (Mistral-7B-v0.3):**
* **Q-Anchored (PopQA):** (Solid blue line) Starts at approximately 0, decreases sharply until layer 10 (reaching approximately -40), then continues to decrease gradually, reaching approximately -60 to -70 at layer 30.
* **A-Anchored (PopQA):** (Dashed orange line) Starts at approximately 0, fluctuates around 0 to 5 throughout the layers.
* **Q-Anchored (TriviaQA):** (Dotted green line) Starts at approximately 0, decreases sharply until layer 10 (reaching approximately -40), then continues to decrease gradually, reaching approximately -60 to -70 at layer 30.
* **A-Anchored (TriviaQA):** (Dashed and dotted gray line) Starts at approximately 0, fluctuates around 0 to 5 throughout the layers.
* **Q-Anchored (HotpotQA):** (Dashed pink line) Starts at approximately 0, decreases sharply until layer 10 (reaching approximately -40), then continues to decrease gradually, reaching approximately -60 to -70 at layer 30.
* **A-Anchored (HotpotQA):** (Dotted gray line) Starts at approximately 0, fluctuates around 0 to 5 throughout the layers.
* **Q-Anchored (NQ):** (Dashed and dotted purple line) Starts at approximately 0, decreases sharply until layer 10 (reaching approximately -40), then continues to decrease gradually, reaching approximately -60 to -70 at layer 30.
* **A-Anchored (NQ):** (Dotted gray line) Starts at approximately 0, fluctuates around 0 to 5 throughout the layers.
### Key Observations
* **Q-Anchored vs. A-Anchored:** Q-Anchored datasets (PopQA, TriviaQA, HotpotQA, NQ) show a significant decrease in performance (ΔP) as the layer number increases for both Mistral-7B-v0.1 and Mistral-7B-v0.3. In contrast, A-Anchored datasets show relatively stable performance across all layers.
* **Model Version Comparison:** The performance trends are similar between Mistral-7B-v0.1 and Mistral-7B-v0.3 for each dataset. However, Mistral-7B-v0.3 appears to have slightly better performance (less negative ΔP) for Q-Anchored datasets in the later layers (20-30).
* **Performance Drop:** The most significant performance drop for Q-Anchored datasets occurs in the initial layers (0-10).
### Interpretation
The data suggests that anchoring by question (Q-Anchored) leads to a degradation in performance as the model processes deeper layers. This could indicate that the model's ability to understand and utilize question-related information diminishes in later layers. Conversely, anchoring by answer (A-Anchored) results in more stable performance, suggesting that answer-related information is better preserved or utilized throughout the model's layers.
The similarity in trends between Mistral-7B-v0.1 and Mistral-7B-v0.3 indicates that the underlying architectural changes between the versions did not fundamentally alter the observed performance degradation pattern for Q-Anchored datasets. The slight improvement in Mistral-7B-v0.3 for Q-Anchored datasets in later layers might suggest some optimization in handling question-related information, but the overall trend remains consistent.
The initial performance drop in the early layers for Q-Anchored datasets could be attributed to the model's initial processing and encoding of the question, where information might be lost or transformed in a way that affects subsequent layers.