## Scatter Plot: Question Embedding vs. LaRS Skill Embedding
### Overview
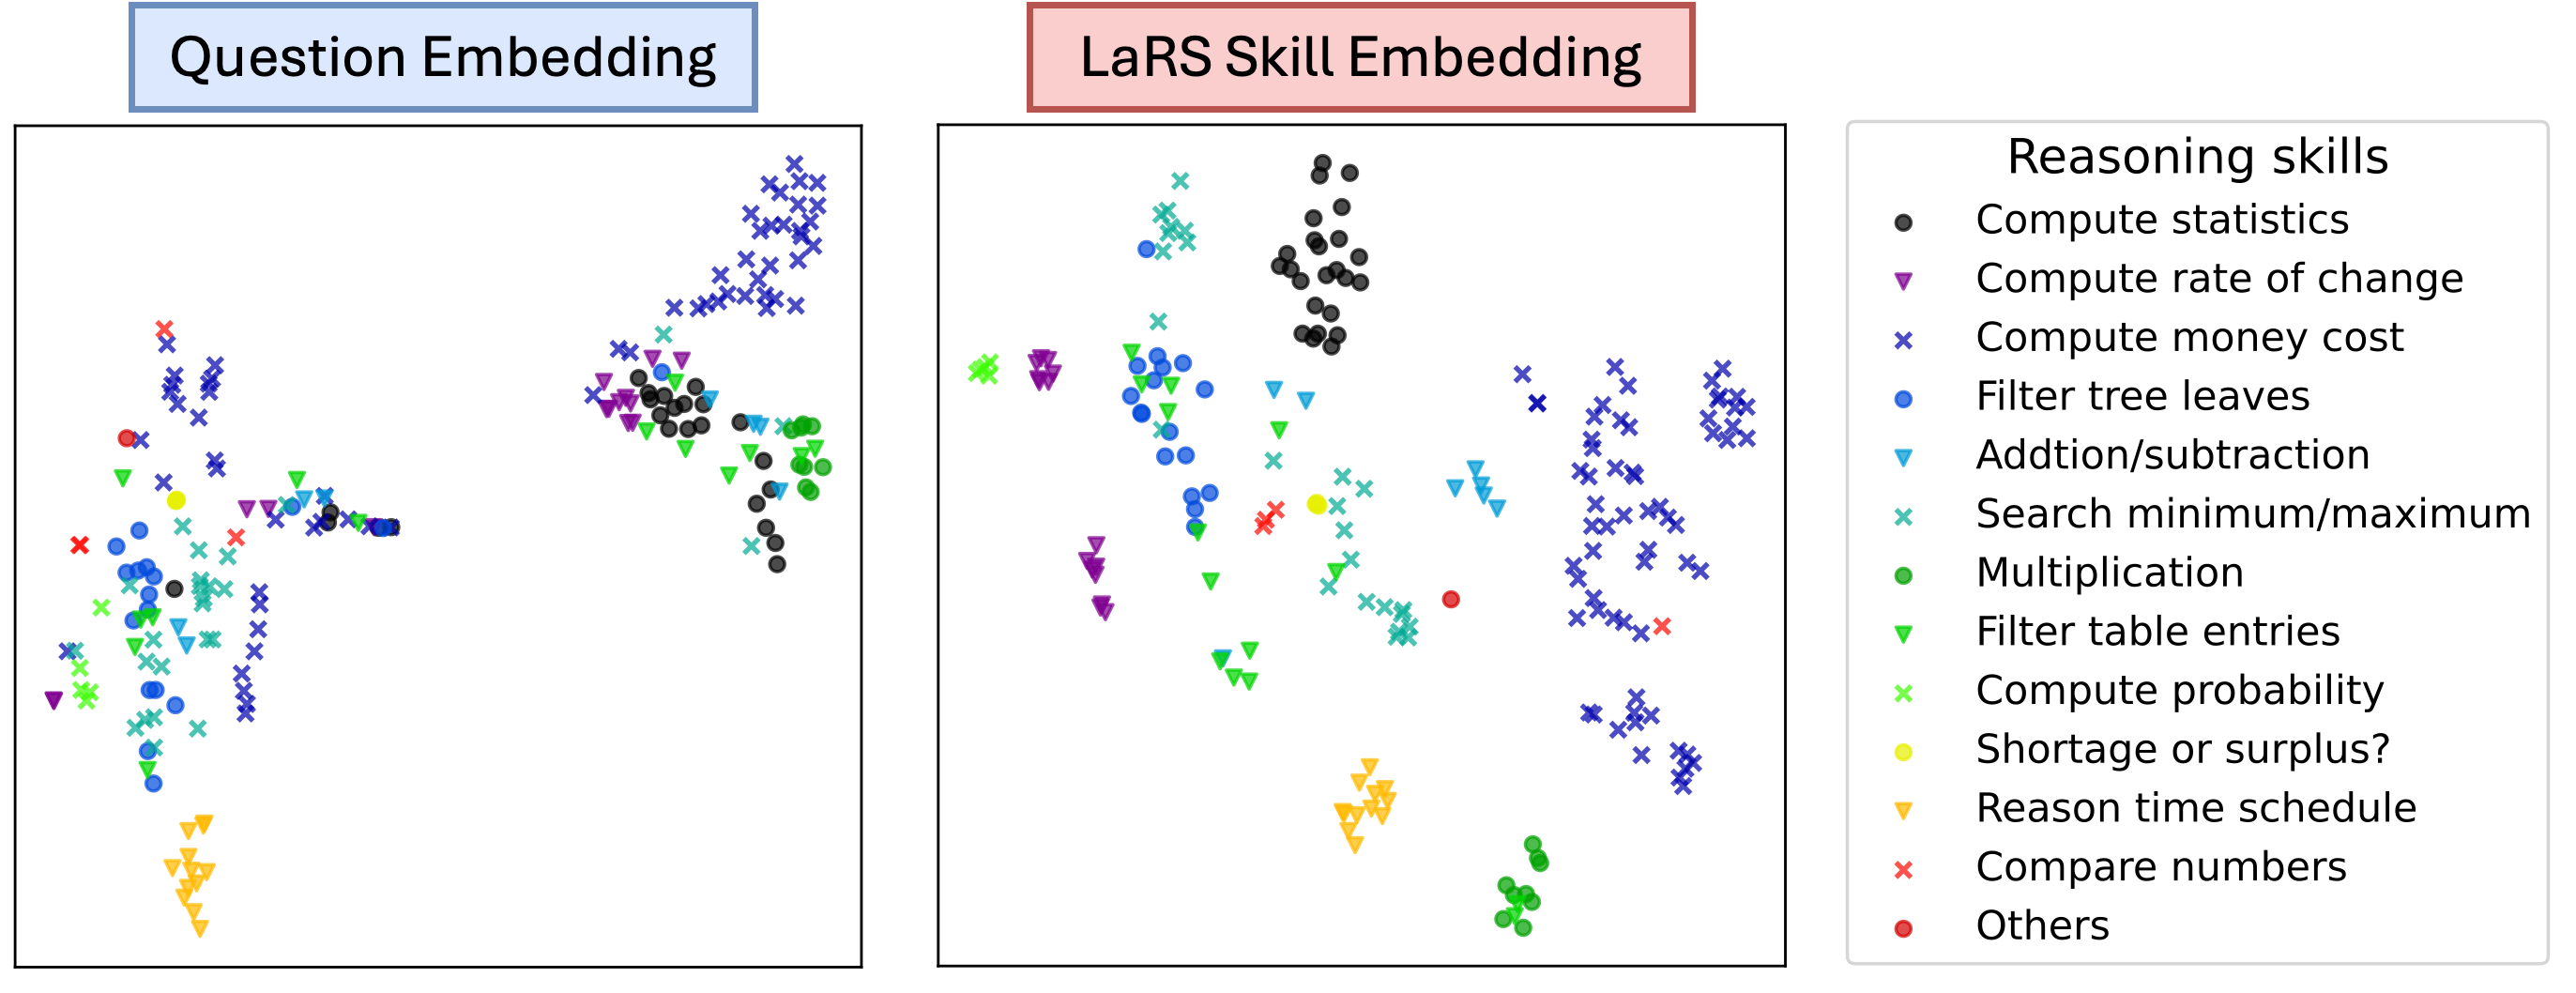
The image presents two scatter plots, "Question Embedding" and "LaRS Skill Embedding," visualizing the distribution of data points representing different reasoning skills. Each data point is color-coded and shaped according to the type of reasoning skill it represents, as defined in the legend on the right. The plots aim to show how questions and skills are embedded in a vector space, potentially indicating relationships or clusters between different reasoning skills.
### Components/Axes
* **Titles:**
* Left Plot: "Question Embedding" (in a blue box)
* Right Plot: "LaRS Skill Embedding" (in a red box)
* Legend Title: "Reasoning skills"
* **Axes:** Neither plot has explicit axes labels or scales. The plots appear to be visualizations of embeddings in a two-dimensional space, where the axes represent abstract feature dimensions.
* **Legend (Right side of image):**
* Black Circle: Compute statistics
* Purple Down-pointing Triangle: Compute rate of change
* Light Blue X: Compute money cost
* Dark Blue Circle: Filter tree leaves
* Light Blue Down-pointing Triangle: Addition/subtraction
* Green X: Search minimum/maximum
* Green Circle: Multiplication
* Green Down-pointing Triangle: Filter table entries
* Light Green X: Compute probability
* Yellow Down-pointing Triangle: Shortage or surplus?
* Yellow Circle: Reason time schedule
* Red X: Compare numbers
* Red Circle: Others
### Detailed Analysis
**1. Question Embedding (Left Plot):**
* **Compute statistics (Black Circle):** Cluster in the top-right quadrant.
* **Compute rate of change (Purple Down-pointing Triangle):** Scattered near the top-left and top-right.
* **Compute money cost (Light Blue X):** Cluster in the center-left.
* **Filter tree leaves (Dark Blue Circle):** Cluster in the center-left.
* **Addition/subtraction (Light Blue Down-pointing Triangle):** Cluster in the center-left.
* **Search minimum/maximum (Green X):** Scattered in the center-left.
* **Multiplication (Green Circle):** Cluster in the center-left.
* **Filter table entries (Green Down-pointing Triangle):** Scattered in the center-left.
* **Compute probability (Light Green X):** Scattered in the center-left.
* **Shortage or surplus? (Yellow Down-pointing Triangle):** Cluster in the bottom-left.
* **Reason time schedule (Yellow Circle):** Scattered in the center-left.
* **Compare numbers (Red X):** Scattered in the top-left and center-left.
* **Others (Red Circle):** Single point in the top-left.
**2. LaRS Skill Embedding (Right Plot):**
* **Compute statistics (Black Circle):** Cluster in the top-left.
* **Compute rate of change (Purple Down-pointing Triangle):** Cluster in the top-left and center-left.
* **Compute money cost (Light Blue X):** Scattered in the top-right and center-left.
* **Filter tree leaves (Dark Blue Circle):** Cluster in the center-left.
* **Addition/subtraction (Light Blue Down-pointing Triangle):** Cluster in the center-left.
* **Search minimum/maximum (Green X):** Scattered in the center.
* **Multiplication (Green Circle):** Cluster in the bottom-right.
* **Filter table entries (Green Down-pointing Triangle):** Cluster in the bottom-left.
* **Compute probability (Light Green X):** Scattered in the center-left.
* **Shortage or surplus? (Yellow Down-pointing Triangle):** Cluster in the bottom-center.
* **Reason time schedule (Yellow Circle):** Single point in the center-left.
* **Compare numbers (Red X):** Scattered in the center.
* **Others (Red Circle):** Single point in the center.
### Key Observations
* In both plots, data points representing the same reasoning skill tend to cluster together, suggesting that the embedding process captures some similarity between skills.
* The "Question Embedding" plot shows a more distinct separation between clusters compared to the "LaRS Skill Embedding" plot.
* Some skills, like "Compute statistics" and "Filter tree leaves," form tight clusters, while others, like "Compute money cost" and "Compare numbers," are more dispersed.
### Interpretation
The scatter plots visualize the embeddings of questions and LaRS skills in a vector space. The clustering of data points suggests that the embedding process successfully captures relationships between different reasoning skills. The "Question Embedding" plot potentially represents how questions are mapped into this space based on the skills they require, while the "LaRS Skill Embedding" plot represents the skills themselves. The relative positions of the clusters may indicate which skills are more similar or related to each other. The differences in cluster tightness between the two plots could reflect variations in how questions and skills are represented or the inherent complexity of the skills themselves. The plots could be used to identify related skills, recommend skills to learn, or analyze the skill requirements of different questions.