\n
## Diagram: Logical Clause Decomposition
### Overview
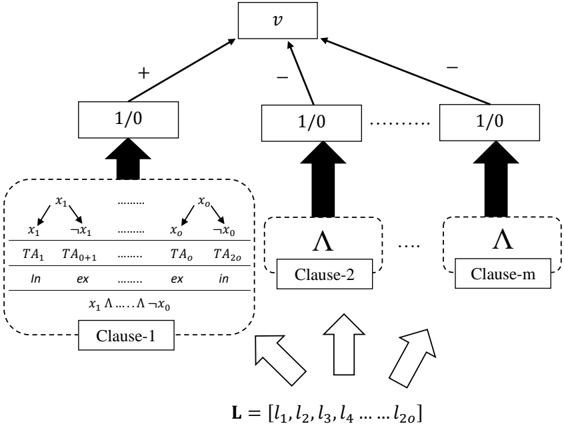
The image depicts a diagram illustrating the decomposition of a logical clause, likely within a SAT solver or similar logical reasoning system. It shows a tree-like structure where a variable 'ν' branches into positive and negative literals, which are further broken down into clauses containing literals and their negations. The bottom of the diagram shows an input list 'L'.
### Components/Axes
The diagram consists of the following components:
* **ν:** A rectangular box at the top, representing a variable.
* **1/0 Boxes:** Rectangular boxes connected to 'ν' via '+' and '-' signs, representing literals (variable assignments).
* **Clause Boxes:** Dotted rectangular boxes containing logical conjunctions (∧) of literals. These represent clauses.
* **Literal Nodes:** Within the clause boxes, nodes representing literals (x₁, x₀, ¬x₁, ¬x₀) and their truth assignments (TA₁, TA₀, TA₁+1, TA₂+0).
* **Input List L:** A list represented as `L = [l₁, l₂, l₃, l₄ … l₂₀]`.
* **Arrows:** Arrows indicating the flow of information or dependency.
* **Labels:** Labels such as "Clause-1", "Clause-2", "Clause-m", "in", "ex".
### Detailed Analysis or Content Details
The diagram can be broken down as follows:
1. **Top Level:** The variable 'ν' branches into positive and negative literals. The positive branch is labeled '+', and the negative branches are labeled '-'.
2. **Literal Representation:** Each branch leads to a box labeled "1/0", representing a literal. This suggests a binary assignment (true/false or 1/0).
3. **Clause Decomposition:** Each literal then feeds into a clause box.
* **Clause-1:** Contains literals x₁ and x₀, along with their truth assignments TA₁ and TA₀. The literals are connected via nodes representing their negations (¬x₁, ¬x₀). The clause is represented as `x₁ ∧ ¬x₀`. Below this clause are labels "in" and "ex".
* **Clause-2 to Clause-m:** Represented by a series of dotted boxes, each containing a logical conjunction (∧). The specific literals within these clauses are not fully detailed, but they follow a similar structure to Clause-1.
4. **Input List:** At the bottom of the diagram, there is an input list 'L' defined as `L = [l₁, l₂, l₃, l₄ … l₂₀]`. Arrows point upwards from this list towards the clause boxes, suggesting that the list provides input for the clause construction or evaluation.
5. **Truth Assignments:** The labels TA₁, TA₀, TA₁+1, TA₂+0 suggest truth assignments or values associated with the literals.
### Key Observations
* The diagram illustrates a hierarchical decomposition of a logical problem.
* The input list 'L' appears to be a source of information for constructing or evaluating the clauses.
* The use of 'in' and 'ex' suggests internal and external factors or states.
* The diagram does not provide specific numerical data, but rather a structural representation of a logical process.
### Interpretation
The diagram likely represents a simplified model of a SAT (Satisfiability) solver or a similar logical reasoning system. The variable 'ν' could represent a decision variable, and the branching represents exploring different assignments (true/false). The clauses represent constraints that must be satisfied. The input list 'L' could represent a set of initial facts or assumptions.
The decomposition into clauses and literals suggests a process of breaking down a complex logical problem into smaller, more manageable subproblems. The truth assignments (TA) indicate the values assigned to the literals during the solving process. The 'in' and 'ex' labels might denote internal state and external input, respectively.
The diagram is abstract and does not provide specific details about the solving algorithm or the nature of the logical problem being solved. However, it provides a clear visual representation of the key components and relationships involved in a logical reasoning process. The ellipsis (...) indicates that the diagram is not exhaustive and that there may be more clauses or literals involved in the complete problem.