## Scatter Plot: Correlation Length vs. Beta
### Overview
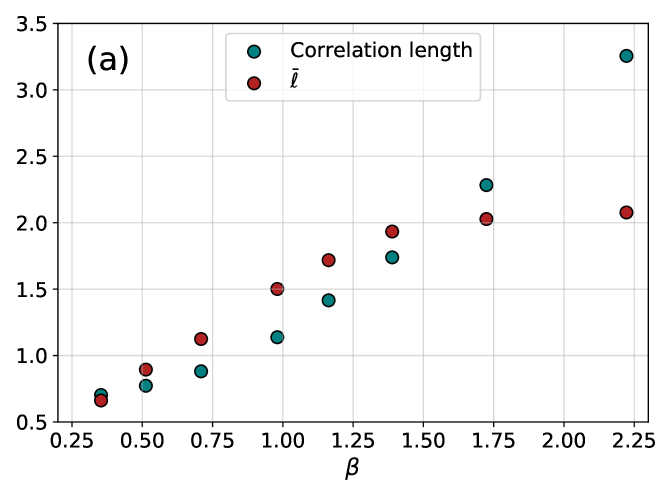
The image presents a scatter plot illustrating the relationship between a parameter denoted as "β" (beta) on the x-axis and two different measures of length on the y-axis: "Correlation length" and a variable represented by "l̄" (l-bar). The plot appears to explore how these length measures change as beta varies.
### Components/Axes
* **X-axis:** Labeled "β" (beta), ranging from approximately 0.25 to 2.25 with increments of 0.25.
* **Y-axis:** Ranges from approximately 0.5 to 3.5 with increments of 0.5. No explicit label is provided, but the data points represent length measurements.
* **Legend:** Located in the top-right corner.
* "Correlation length" - represented by teal/cyan circles.
* "l̄" (l-bar) - represented by maroon/red circles.
* **Title:** "(a)" in the top-left corner, likely indicating this is part of a larger figure.
* **Grid:** A light gray grid is present, aiding in the visual estimation of data point values.
### Detailed Analysis
The plot contains approximately 12 data points for each series (Correlation length and l̄).
**Correlation Length (Teal/Cyan Circles):**
The trend for Correlation length is generally upward.
* β ≈ 0.25: Correlation length ≈ 0.6
* β ≈ 0.50: Correlation length ≈ 0.75
* β ≈ 0.75: Correlation length ≈ 1.0
* β ≈ 1.00: Correlation length ≈ 1.4
* β ≈ 1.25: Correlation length ≈ 1.8
* β ≈ 1.50: Correlation length ≈ 2.1
* β ≈ 1.75: Correlation length ≈ 2.3
* β ≈ 2.00: Correlation length ≈ 3.1
* β ≈ 2.25: Correlation length ≈ 3.1
**l̄ (Maroon/Red Circles):**
The trend for l̄ is also generally upward, but appears less linear and more scattered than the Correlation length data.
* β ≈ 0.25: l̄ ≈ 0.6
* β ≈ 0.50: l̄ ≈ 0.8
* β ≈ 0.75: l̄ ≈ 1.2
* β ≈ 1.00: l̄ ≈ 1.5
* β ≈ 1.25: l̄ ≈ 1.8
* β ≈ 1.50: l̄ ≈ 1.9
* β ≈ 1.75: l̄ ≈ 2.0
* β ≈ 2.00: l̄ ≈ 2.1
* β ≈ 2.25: l̄ ≈ 2.1
### Key Observations
* Both Correlation length and l̄ generally increase with increasing β.
* The Correlation length data appears to have a stronger positive correlation with β than the l̄ data.
* The Correlation length data shows a more pronounced increase in the higher β range (β > 1.5).
* The l̄ data is more scattered, suggesting a weaker or more complex relationship with β.
* At β ≈ 0.25, the values for Correlation length and l̄ are nearly identical.
### Interpretation
The plot suggests that as the parameter β increases, both the correlation length and the length represented by l̄ tend to increase. However, the correlation length appears to be more directly and consistently influenced by β than l̄. This could indicate that the correlation length is a more sensitive measure of the underlying system's behavior as β changes. The scattering of the l̄ data might suggest that other factors are influencing its value, or that the relationship between l̄ and β is non-linear and more complex. The initial similarity in values at low β suggests that at small values of β, these two length scales are closely related, but diverge as β increases. The "(a)" label suggests this is part of a larger study, and further plots might reveal the context and significance of these observations.