## Diagram: State Transition Diagram for a Circuit
### Overview
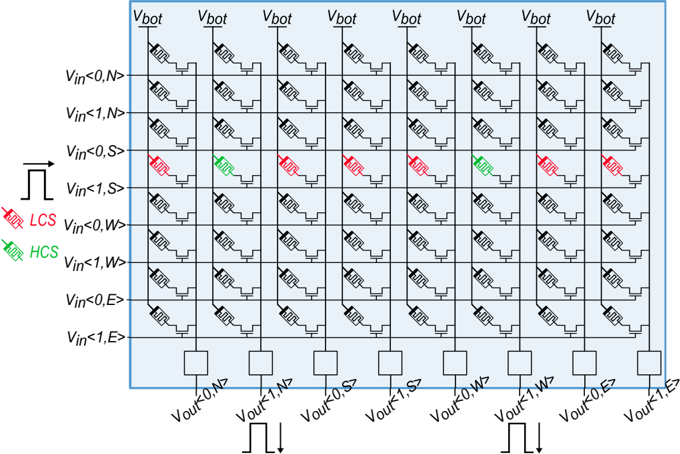
The image depicts a state transition diagram for a circuit, likely a sequential logic circuit. It shows the behavior of the circuit under different input conditions, represented by various combinations of Vin (Input Voltage) and Vout (Output Voltage). The diagram is organized as a grid, with input states along the vertical axis and output states along the horizontal axis. Each cell in the grid represents a possible state transition, indicated by the presence of a transistor symbol and a color-coded marker.
### Components/Axes
* **Vertical Axis (Input States):** Represents the input conditions, labeled as follows:
* Vin < 0, N> (approximately -0.2V, Negative)
* Vin < 1, N> (approximately 0.8V, Negative)
* Vin < 0, S> (approximately -0.2V, Slow)
* Vin < 1, S> (approximately 0.8V, Slow)
* LCS Vin < 0, W> (approximately -0.2V, Weak)
* HCS Vin < 1, W> (approximately 0.8V, Weak)
* Vin < 0, E> (approximately -0.2V, Early)
* Vin < 1, E> (approximately 0.8V, Early)
* **Horizontal Axis (Output States):** Represents the output conditions, labeled as follows:
* Vout < 0, N> (approximately -0.2V, Negative)
* Vout < 1, N> (approximately 0.8V, Negative)
* Vout < 0, S> (approximately -0.2V, Slow)
* Vout < 1, S> (approximately 0.8V, Slow)
* Vout < 0, W> (approximately -0.2V, Weak)
* Vout < 1, W> (approximately 0.8V, Weak)
* Vout < 0, E> (approximately -0.2V, Early)
* Vout < 1, E> (approximately 0.8V, Early)
* **Legend:**
* Red markers (LCS): Represent a Low Current State.
* Green markers (HCS): Represent a High Current State.
* **Top Row:** Labeled "Vbot" repeated across all columns.
* **Bottom Row:** Shows waveform symbols representing Vout, with alternating positive and negative pulses.
* **Left Column:** Shows waveform symbols representing Vin, with alternating positive and negative pulses.
### Detailed Analysis
The diagram consists of an 8x8 grid. Each cell contains a transistor symbol, and some cells also contain a colored marker (red or green). The presence of a marker indicates a specific current state (LCS or HCS).
* **Vin < 0, N> Row:** Most cells in this row are marked with red (LCS) markers. Vout < 1, N> and Vout < 1, S> have green (HCS) markers.
* **Vin < 1, N> Row:** Most cells are marked with red (LCS) markers. Vout < 1, N> and Vout < 1, S> have green (HCS) markers.
* **Vin < 0, S> Row:** Most cells are marked with red (LCS) markers. Vout < 1, N> and Vout < 1, S> have green (HCS) markers.
* **Vin < 1, S> Row:** Most cells are marked with red (LCS) markers. Vout < 1, N> and Vout < 1, S> have green (HCS) markers.
* **LCS Vin < 0, W> Row:** Most cells are marked with red (LCS) markers. Vout < 1, N> and Vout < 1, S> have green (HCS) markers.
* **HCS Vin < 1, W> Row:** Most cells are marked with red (LCS) markers. Vout < 1, N> and Vout < 1, S> have green (HCS) markers.
* **Vin < 0, E> Row:** Most cells are marked with red (LCS) markers. Vout < 1, N> and Vout < 1, S> have green (HCS) markers.
* **Vin < 1, E> Row:** Most cells are marked with red (LCS) markers. Vout < 1, N> and Vout < 1, S> have green (HCS) markers.
The transistor symbols within each cell appear consistent, suggesting a similar circuit configuration for each state transition.
### Key Observations
* The majority of state transitions result in a Low Current State (LCS), indicated by the prevalence of red markers.
* Transitions to a High Current State (HCS) are more likely when Vout is < 1, N or < 1, S.
* The diagram suggests a strong dependency between input and output voltage levels and the resulting current state.
* The "Vbot" label at the top of the diagram is unclear in its function without further context.
### Interpretation
This diagram likely represents the behavior of a digital circuit, possibly a latch or a flip-flop. The input voltage (Vin) and output voltage (Vout) define the current state of the circuit, and the colored markers indicate whether the circuit is in a Low Current State (LCS) or a High Current State (HCS). The diagram demonstrates how the circuit transitions between these states based on the input conditions.
The consistent transistor symbol across all cells suggests a uniform circuit structure, while the varying current states indicate different operating modes. The prevalence of LCS suggests that the circuit is designed to minimize power consumption in most states. The specific meaning of "N", "S", "W", and "E" in the voltage labels is unclear without additional context, but they likely represent different operating conditions or timing phases. The "Vbot" label could refer to a bottom voltage rail or a reference voltage.
The diagram provides a visual representation of the circuit's state machine, allowing engineers to analyze its behavior and identify potential design flaws. The clear distinction between LCS and HCS states is crucial for understanding the circuit's functionality and performance.