## Charts: Leader-Follower Multi-Agent System Performance
### Overview
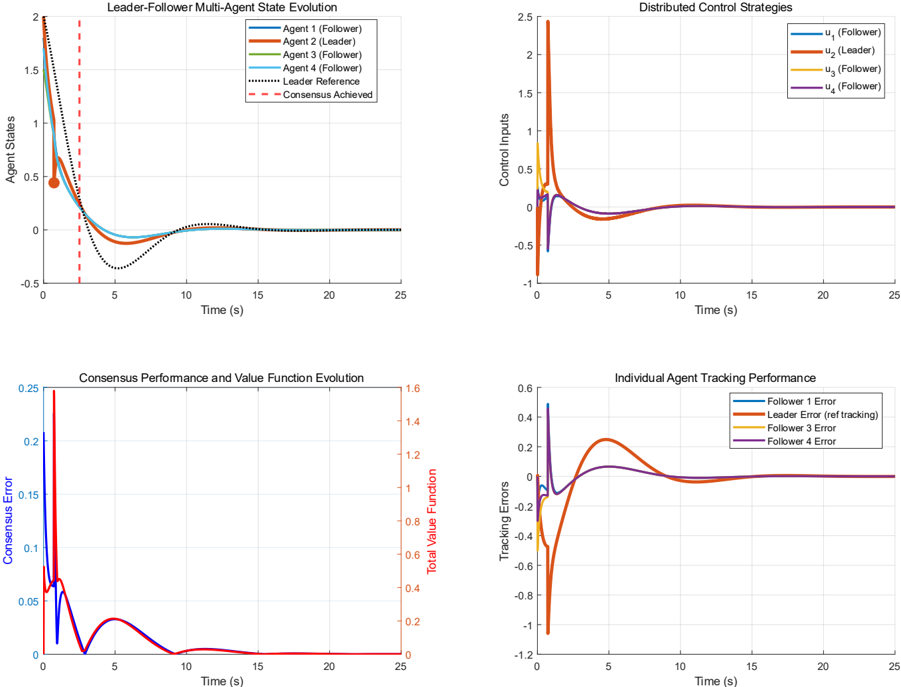
The image presents four charts illustrating the performance of a leader-follower multi-agent system. The charts display state evolution, control strategies, consensus performance, and individual agent tracking performance over a time span of 25 seconds.
### Components/Axes
* **Chart 1: Leader-Follower Multi-Agent State Evolution**
* X-axis: Time (s) - Scale: 0 to 25 seconds
* Y-axis: Agent State - Scale: 0 to 2.0
* Data Series:
* Agent 1 (Follower) - Blue Line
* Agent 2 (Follower) - Orange Line
* Agent 3 (Follower) - Green Line
* Agent 4 (Follower) - Red Line
* Leader Reference - Dashed Black Line
* Consensus Achieved - Black Line
* **Chart 2: Distributed Control Strategies**
* X-axis: Time (s) - Scale: 0 to 25 seconds
* Y-axis: Control Inputs - Scale: -0.5 to 2.5
* Data Series:
* u1 (Follower) - Blue Line
* u2 (Leader) - Orange Line
* u3 (Follower) - Green Line
* u4 (Follower) - Red Line
* **Chart 3: Consensus Performance and Value Function Evolution**
* X-axis: Time (s) - Scale: 0 to 25 seconds
* Y-axis (Left): Consensus Error - Scale: 0 to 0.25
* Y-axis (Right): Total Value Function - Scale: 0 to 1.6
* Data Series:
* Consensus Error - Purple Line
* Total Value Function - Magenta Line
* **Chart 4: Individual Agent Tracking Performance**
* X-axis: Time (s) - Scale: 0 to 25 seconds
* Y-axis: Tracking Errors - Scale: -1.2 to 0.4
* Data Series:
* Follower 1 Error - Blue Line
* Leader Error (ref tracking) - Orange Line
* Follower 3 Error - Green Line
* Follower 4 Error - Red Line
### Detailed Analysis or Content Details
* **Chart 1: Leader-Follower Multi-Agent State Evolution**
* The blue (Agent 1), orange (Agent 2), green (Agent 3), and red (Agent 4) lines initially show a peak around 1.5 at t=0s, then rapidly decrease.
* Agent 1 (Blue): Starts at approximately 1.5, drops to ~0.1 by t=3s, oscillates around 0.05-0.1 for the remainder of the time.
* Agent 2 (Orange): Starts at approximately 1.5, drops to ~0.1 by t=3s, oscillates around 0.05-0.1 for the remainder of the time.
* Agent 3 (Green): Starts at approximately 1.5, drops to ~0.1 by t=3s, oscillates around 0.05-0.1 for the remainder of the time.
* Agent 4 (Red): Starts at approximately 1.5, drops to ~0.1 by t=3s, oscillates around 0.05-0.1 for the remainder of the time.
* Leader Reference (Black Dashed): Starts at 0, increases to approximately 0.5 at t=2s, then remains relatively constant.
* Consensus Achieved (Black Solid): Starts at approximately 0.5 at t=3s, then remains relatively constant.
* **Chart 2: Distributed Control Strategies**
* All control inputs (blue, orange, green, red) remain close to 0 throughout the 25-second period.
* u1 (Blue): Fluctuates between -0.1 and 0.1.
* u2 (Orange): Fluctuates between -0.1 and 0.1.
* u3 (Green): Fluctuates between -0.1 and 0.1.
* u4 (Red): Fluctuates between -0.1 and 0.1.
* **Chart 3: Consensus Performance and Value Function Evolution**
* Consensus Error (Purple): Peaks at approximately 0.2 at t=0s, rapidly decreases to near 0 by t=3s, and remains close to 0 for the rest of the time.
* Total Value Function (Magenta): Starts at approximately 1.4, decreases to approximately 0.4 by t=3s, and remains relatively constant.
* **Chart 4: Individual Agent Tracking Performance**
* Follower 1 Error (Blue): Starts at approximately 0.2, decreases to approximately -0.1 by t=5s, and oscillates around -0.1 for the remainder of the time.
* Leader Error (Orange): Starts at approximately 0.2, decreases to approximately -0.8 by t=5s, and oscillates around -0.8 for the remainder of the time.
* Follower 3 Error (Green): Starts at approximately 0.2, decreases to approximately -0.1 by t=5s, and oscillates around -0.1 for the remainder of the time.
* Follower 4 Error (Red): Starts at approximately 0.2, decreases to approximately -0.1 by t=5s, and oscillates around -0.1 for the remainder of the time.
### Key Observations
* All follower agents converge to a similar state relatively quickly (within 3 seconds).
* Control inputs are minimal, suggesting a stable system.
* Consensus error is minimized after the initial transient period.
* The leader error is significantly more negative than the follower errors, indicating a larger tracking error for the leader.
### Interpretation
The data suggests a successful implementation of a leader-follower multi-agent system with distributed control. The rapid convergence of the follower agents to a similar state, coupled with minimal control inputs, indicates a stable and efficient system. The low consensus error confirms that the agents are effectively coordinating their actions. The larger tracking error of the leader might indicate a more challenging tracking task for the leader or a need for adjustments to the control strategy. The value function decreasing and stabilizing suggests the system is reaching a stable operating point. The initial peak in agent states and consensus error likely represents the system's response to initial conditions or a disturbance. The overall behavior demonstrates the system's ability to achieve consensus and maintain stable operation over time.