\n
## Line Chart: Test AUROC vs. Layer Index
### Overview
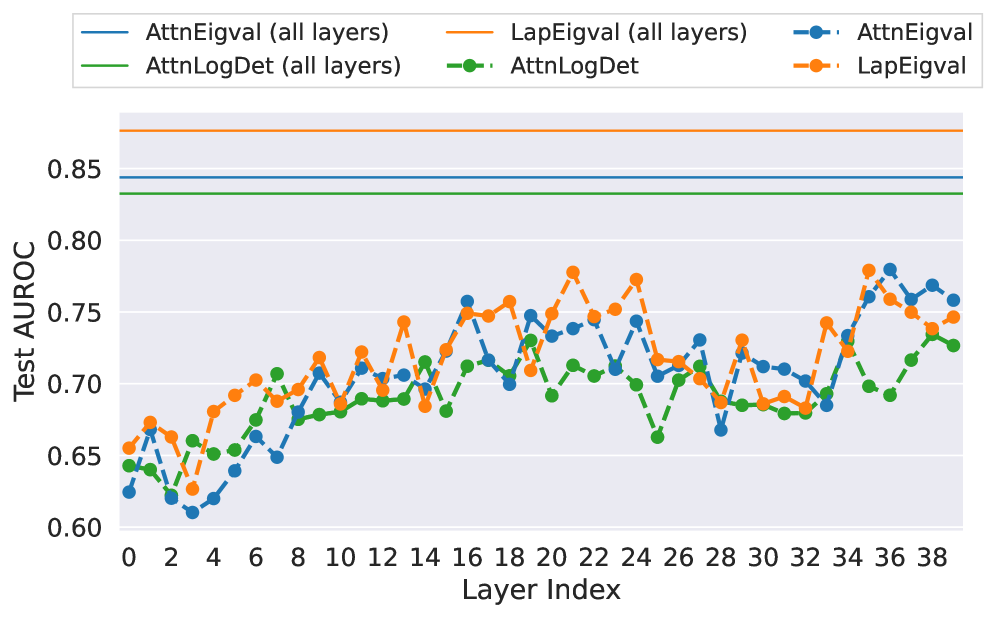
This image presents a line chart comparing the Test Area Under the Receiver Operating Characteristic curve (AUROC) across different methods (AttnEigenval, AttnLogDet, LapEigenval, LapLogDet) as a function of Layer Index. The chart displays six distinct lines, each representing a different method, plotted against layer indices ranging from 0 to 38.
### Components/Axes
* **X-axis:** Layer Index (ranging from 0 to 38, with increments of 2)
* **Y-axis:** Test AUROC (ranging from 0.60 to 0.85, with increments of 0.05)
* **Legend:** Located at the top of the chart, identifying each line by color and method.
* AttnEigenval (all layers) - Dark Blue Solid Line
* AttnLogDet (all layers) - Dark Green Solid Line
* LapEigenval (all layers) - Orange Solid Line
* AttnEigenval - Blue Dashed Line
* AttnLogDet - Green Dashed Line
* LapEigenval - Orange Dotted Line
### Detailed Analysis
Here's a breakdown of each line's trend and approximate data points. Note that values are estimated from the visual representation.
* **AttnEigenval (all layers) - Dark Blue Solid Line:** This line generally slopes upward from Layer Index 0 to approximately 16, then fluctuates between 0.72 and 0.78.
* Layer 0: ~0.66
* Layer 4: ~0.68
* Layer 8: ~0.70
* Layer 12: ~0.72
* Layer 16: ~0.74
* Layer 20: ~0.75
* Layer 24: ~0.74
* Layer 28: ~0.73
* Layer 32: ~0.75
* Layer 36: ~0.76
* Layer 38: ~0.77
* **AttnLogDet (all layers) - Dark Green Solid Line:** This line shows an initial increase up to Layer Index 10, followed by fluctuations between 0.68 and 0.74.
* Layer 0: ~0.64
* Layer 4: ~0.66
* Layer 8: ~0.69
* Layer 12: ~0.71
* Layer 16: ~0.72
* Layer 20: ~0.72
* Layer 24: ~0.70
* Layer 28: ~0.71
* Layer 32: ~0.72
* Layer 36: ~0.71
* Layer 38: ~0.70
* **LapEigenval (all layers) - Orange Solid Line:** This line exhibits a steady increase from Layer Index 0 to approximately 20, then plateaus and fluctuates between 0.72 and 0.78.
* Layer 0: ~0.66
* Layer 4: ~0.69
* Layer 8: ~0.71
* Layer 12: ~0.73
* Layer 16: ~0.75
* Layer 20: ~0.76
* Layer 24: ~0.76
* Layer 28: ~0.75
* Layer 32: ~0.76
* Layer 36: ~0.77
* Layer 38: ~0.78
* **AttnEigenval - Blue Dashed Line:** This line fluctuates significantly, starting around 0.65 and reaching a peak around 0.77 at Layer Index 22, then decreasing to around 0.72.
* Layer 0: ~0.65
* Layer 4: ~0.66
* Layer 8: ~0.68
* Layer 12: ~0.70
* Layer 16: ~0.72
* Layer 20: ~0.75
* Layer 24: ~0.74
* Layer 28: ~0.72
* Layer 32: ~0.74
* Layer 36: ~0.75
* Layer 38: ~0.74
* **AttnLogDet - Green Dashed Line:** This line also fluctuates, starting around 0.64 and peaking around 0.75 at Layer Index 24, then decreasing to around 0.70.
* Layer 0: ~0.64
* Layer 4: ~0.65
* Layer 8: ~0.67
* Layer 12: ~0.69
* Layer 16: ~0.71
* Layer 20: ~0.73
* Layer 24: ~0.75
* Layer 28: ~0.73
* Layer 32: ~0.72
* Layer 36: ~0.71
* Layer 38: ~0.70
* **LapEigenval - Orange Dotted Line:** This line shows a gradual increase from 0.66 to approximately 0.76 at Layer Index 20, then fluctuates between 0.72 and 0.78.
* Layer 0: ~0.66
* Layer 4: ~0.68
* Layer 8: ~0.70
* Layer 12: ~0.72
* Layer 16: ~0.74
* Layer 20: ~0.76
* Layer 24: ~0.75
* Layer 28: ~0.74
* Layer 32: ~0.75
* Layer 36: ~0.76
* Layer 38: ~0.77
### Key Observations
* The "all layers" methods (solid lines) generally exhibit smoother trends compared to the individual layer methods (dashed and dotted lines).
* LapEigenval (all layers) consistently shows the highest AUROC values, particularly after Layer Index 16.
* The dashed and dotted lines show more variability, suggesting that the performance of individual layers fluctuates more than the aggregated "all layers" performance.
* There is a general trend of increasing AUROC with increasing Layer Index, up to a certain point, after which the performance plateaus or fluctuates.
### Interpretation
The chart demonstrates the performance of different methods for analyzing layers in a model, as measured by the Test AUROC. The consistent higher performance of LapEigenval (all layers) suggests that this method is more robust and effective at discriminating between classes across all layers. The fluctuations observed in the individual layer methods indicate that the effectiveness of these methods varies depending on the specific layer being analyzed. The initial increase in AUROC with Layer Index suggests that the model learns more discriminative features as it progresses through the layers. The plateauing or fluctuation in performance after a certain layer index could indicate that the model has reached its maximum discriminative capacity or that further layers introduce noise or redundancy. The difference between the "all layers" and individual layer methods highlights the benefits of aggregating information across layers to obtain a more stable and reliable performance metric.