## Line Chart: Test AUROC Across Model Layers for Different Metrics
### Overview
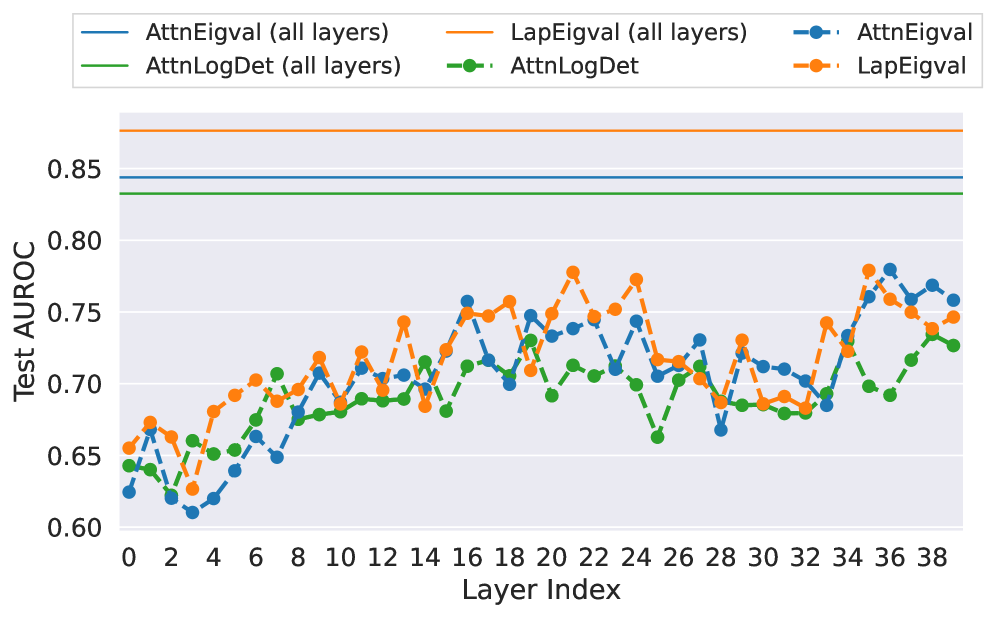
This image is a line chart comparing the performance (Test AUROC) of six different metrics or methods across the layers of a neural network model (Layer Index 0 to 38). The chart displays both aggregate performance (solid lines) and per-layer performance (dashed lines with markers). The overall trend shows that per-layer metrics fluctuate significantly, while the aggregate metrics remain constant.
### Components/Axes
* **X-Axis:** Labeled "Layer Index". It is a linear scale with major tick marks every 2 units, ranging from 0 to 38.
* **Y-Axis:** Labeled "Test AUROC". It is a linear scale with major tick marks every 0.05 units, ranging from 0.60 to 0.85.
* **Legend:** Positioned at the top center of the chart. It contains six entries, defining the color and line style for each data series:
1. `AttnEigval (all layers)`: Solid blue line.
2. `AttnLogDet (all layers)`: Solid green line.
3. `LapEigval (all layers)`: Solid orange line.
4. `AttnEigval`: Dashed blue line with circular markers.
5. `AttnLogDet`: Dashed green line with circular markers.
6. `LapEigval`: Dashed orange line with circular markers.
* **Grid:** A light gray grid is present in the background.
### Detailed Analysis
**1. Aggregate Metrics (Solid Lines - "all layers"):**
These lines are horizontal, indicating a single, constant AUROC value for the entire model, not varying by layer.
* **`LapEigval (all layers)` (Solid Orange):** The highest-performing aggregate metric. It is a flat line positioned at approximately **AUROC = 0.88**.
* **`AttnEigval (all layers)` (Solid Blue):** The second-highest aggregate metric. It is a flat line positioned at approximately **AUROC = 0.845**.
* **`AttnLogDet (all layers)` (Solid Green):** The lowest of the aggregate metrics. It is a flat line positioned at approximately **AUROC = 0.835**.
**2. Per-Layer Metrics (Dashed Lines with Markers):**
These lines show the AUROC value when the metric is computed using only the specified layer's information. They exhibit significant fluctuation across layers.
* **`LapEigval` (Dashed Orange):**
* **Trend:** Shows a general, noisy upward trend from layer 0 to layer 38. It starts around 0.655, dips to a low near 0.63 at layer 3, then climbs with high variance.
* **Key Points:** Notable peaks occur at approximately layer 20 (AUROC ~0.78), layer 24 (~0.775), and layer 36 (~0.78). A significant dip occurs around layer 28 (~0.685).
* **`AttnEigval` (Dashed Blue):**
* **Trend:** Also shows a general upward trend with high variance, often moving in tandem with `LapEigval` but typically at a slightly lower AUROC.
* **Key Points:** Starts around 0.625. Has a pronounced low at layer 4 (~0.61). Peaks near layer 16 (~0.755) and layer 36 (~0.78). Dips sharply at layer 28 (~0.67).
* **`AttnLogDet` (Dashed Green):**
* **Trend:** Exhibits a more moderate upward trend compared to the other two per-layer metrics. It generally has the lowest AUROC values among the dashed lines.
* **Key Points:** Starts around 0.645. Shows a notable dip at layer 25 (~0.665). Its highest points are near layer 20 (~0.73) and layer 38 (~0.73).
### Key Observations
1. **Performance Hierarchy:** There is a clear and consistent hierarchy in performance: `LapEigval` > `AttnEigval` > `AttnLogDet`. This holds true for both the aggregate (solid lines) and per-layer (dashed lines) versions of the metrics.
2. **Aggregate vs. Per-Layer:** The aggregate "all layers" metrics significantly outperform any single-layer metric. The best per-layer AUROC (~0.78) is still well below the worst aggregate AUROC (~0.835).
3. **Layer Sensitivity:** The per-layer metrics are highly sensitive to the specific layer index, showing large swings in AUROC. Performance is not uniform across the network depth.
4. **Correlated Fluctuations:** The three per-layer metrics (`AttnEigval`, `AttnLogDet`, `LapEigval`) often fluctuate in a correlated manner. For example, they all show a notable dip around layer 28 and a peak around layer 36.
5. **Early Layer Volatility:** The first 10 layers (0-10) show particularly high volatility and lower overall performance for all per-layer metrics.
### Interpretation
This chart likely evaluates different methods for assessing the quality or information content of attention mechanisms (`Attn`) or Laplacian-based features (`Lap`) within a deep neural network, possibly a transformer. The "Test AUROC" suggests these metrics are being used for a binary classification task, such as detecting out-of-distribution samples or adversarial examples.
* **What the data suggests:** The `LapEigval` method (likely based on eigenvalues of a graph Laplacian derived from the network) is the most effective single metric, both when applied to the whole network and to individual layers. The fact that aggregate metrics outperform per-layer ones indicates that combining information across all layers provides a much stronger signal than relying on any single layer.
* **Relationship between elements:** The correlated dips and peaks in the per-layer metrics suggest that certain layers (e.g., around layer 28) are universally "weaker" or contain less discriminative information for this specific task, while others (e.g., around layer 36) are "stronger." This could reflect the functional specialization of different network depths.
* **Notable anomaly:** The very flat, high performance of `LapEigval (all layers)` compared to the noisy per-layer `LapEigval` suggests that the eigenvalue-based method benefits immensely from integration across the entire network hierarchy, smoothing out the layer-specific noise to produce a robust, high-quality signal. The investigation would focus on why the Laplacian eigenvalue approach is superior to attention-based eigenvalue (`AttnEigval`) and log-determinant (`AttnLogDet`) approaches for this task.