## Line Chart: Memory Access Bandwidth vs. Number of SM Hosts
### Overview
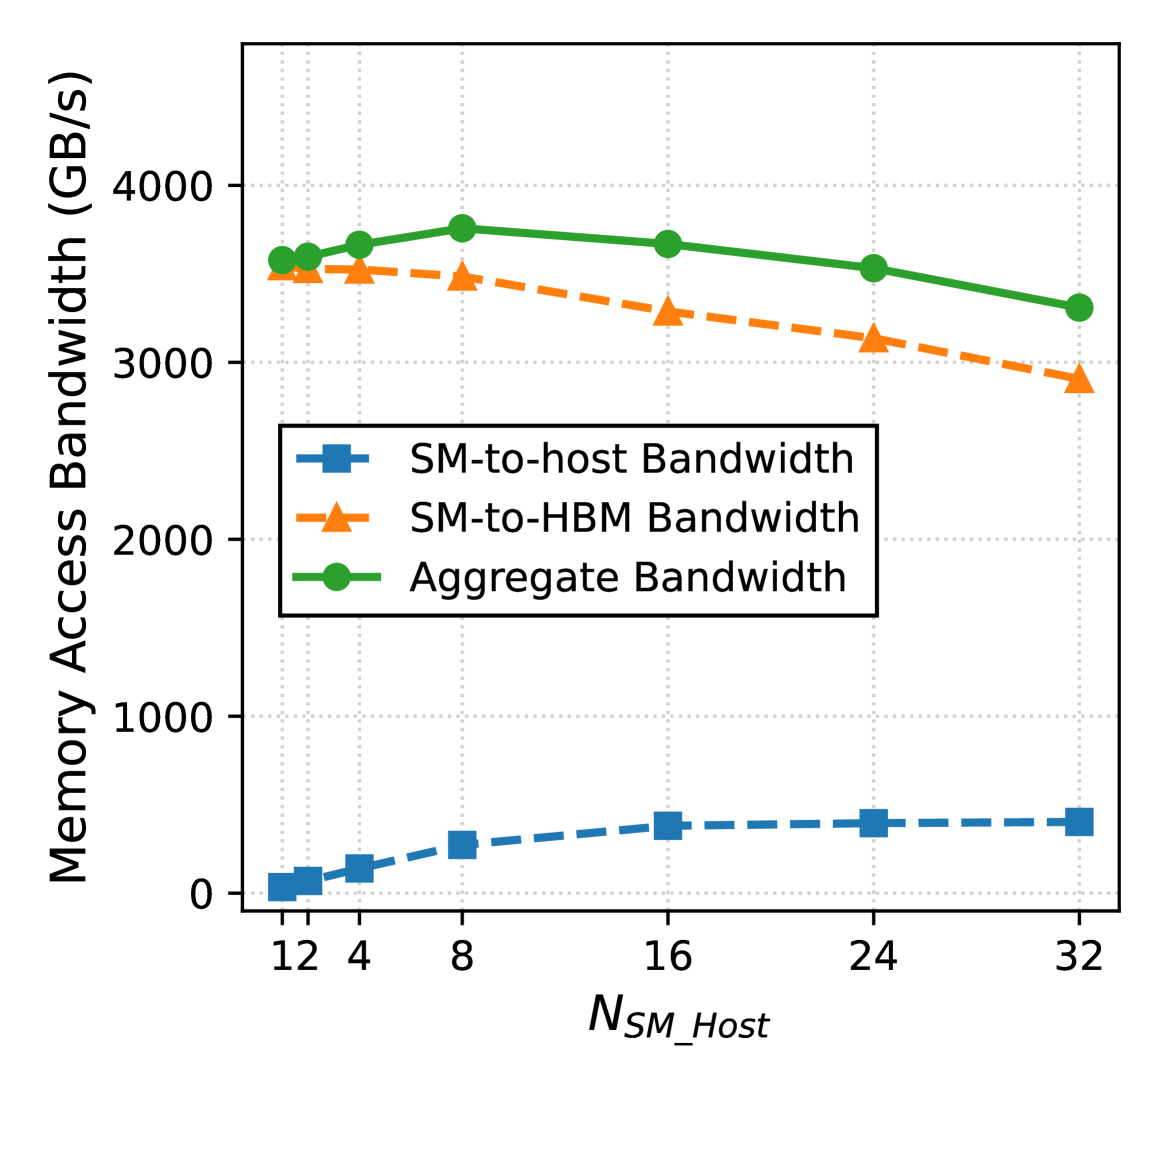
The chart illustrates the relationship between the number of SM hosts (`N_SM_Host`) and three types of memory access bandwidth: SM-to-host, SM-to-HBM, and Aggregate Bandwidth. The y-axis represents bandwidth in GB/s, while the x-axis represents the number of SM hosts, ranging from 12 to 32.
### Components/Axes
- **X-axis (Horizontal)**: Labeled `N_SM_Host`, with values at 12, 4, 8, 16, 24, and 32.
- **Y-axis (Vertical)**: Labeled `Memory Access Bandwidth (GB/s)`, ranging from 0 to 4000.
- **Legend**: Located in the bottom-left corner, with three entries:
- **Blue squares**: SM-to-host Bandwidth
- **Orange triangles**: SM-to-HBM Bandwidth
- **Green circles**: Aggregate Bandwidth
### Detailed Analysis
1. **SM-to-host Bandwidth (Blue Squares)**:
- Starts at ~100 GB/s for `N_SM_Host = 12`.
- Increases to ~400 GB/s at `N_SM_Host = 8`.
- Remains relatively stable (~400 GB/s) for `N_SM_Host = 16, 24, 32`.
2. **SM-to-HBM Bandwidth (Orange Triangles)**:
- Begins at ~3500 GB/s for `N_SM_Host = 12`.
- Decreases steadily to ~3000 GB/s at `N_SM_Host = 32`.
3. **Aggregate Bandwidth (Green Circles)**:
- Starts at ~3500 GB/s for `N_SM_Host = 12`.
- Peaks at ~3800 GB/s at `N_SM_Host = 8`.
- Declines to ~3300 GB/s at `N_SM_Host = 32`.
### Key Observations
- **SM-to-host Bandwidth** shows a sharp increase until `N_SM_Host = 8`, then plateaus.
- **SM-to-HBM Bandwidth** decreases linearly as `N_SM_Host` increases.
- **Aggregate Bandwidth** peaks at `N_SM_Host = 8` before declining, suggesting diminishing returns beyond this point.
### Interpretation
The data suggests that increasing the number of SM hosts initially improves SM-to-host bandwidth but does not scale linearly beyond 8 hosts. Conversely, SM-to-HBM bandwidth decreases with more hosts, possibly due to resource contention or architectural limitations. The Aggregate Bandwidth peaks at 8 hosts, indicating an optimal configuration for total memory access efficiency. Beyond this point, adding more SM hosts reduces overall performance, highlighting a trade-off between scalability and bandwidth efficiency.
**Notable Anomaly**: The Aggregate Bandwidth’s peak at `N_SM_Host = 8` contrasts with the SM-to-HBM trend, suggesting a bottleneck or optimization in the system’s design at this specific configuration.