# Technical Document Extraction: Directed Graph Diagram
## 1. Image Overview
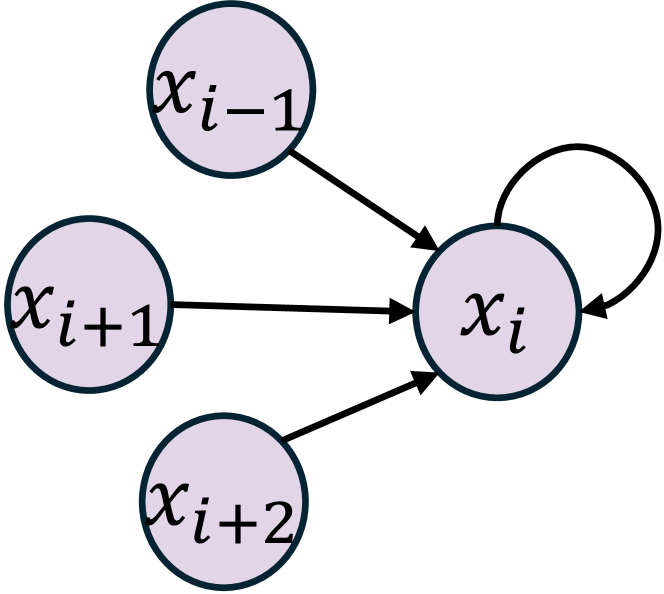
This image is a technical diagram representing a **Directed Graph**, likely illustrating a state transition, a neural network node, or a mathematical dependency structure. It consists of four circular nodes and three directed edges (arrows).
## 2. Component Isolation
### Node Analysis
All nodes are visually identical: light purple/lavender fill with a thick dark navy/black border. Each node contains a mathematical label in black italicized serif font.
| Node Position | Label | Description |
| :--- | :--- | :--- |
| **Top Left** | $x_{i-1}$ | Input node representing a previous state or index. |
| **Middle Left** | $x_{i+1}$ | Input node representing a subsequent index. |
| **Bottom Left** | $x_{i+2}$ | Input node representing a further subsequent index. |
| **Right** | $x_{i}$ | The central/target node receiving all inputs. |
### Edge (Flow) Analysis
The diagram illustrates the flow of information or dependency toward the central node $x_{i}$.
1. **Inbound Edge 1:** A straight arrow originates from $x_{i-1}$ and points to $x_{i}$.
2. **Inbound Edge 2:** A straight arrow originates from $x_{i+1}$ and points to $x_{i}$.
3. **Inbound Edge 3:** A straight arrow originates from $x_{i+2}$ and points to $x_{i}$.