\n
## Bar Chart: Accuracy of Voting Methods
### Overview
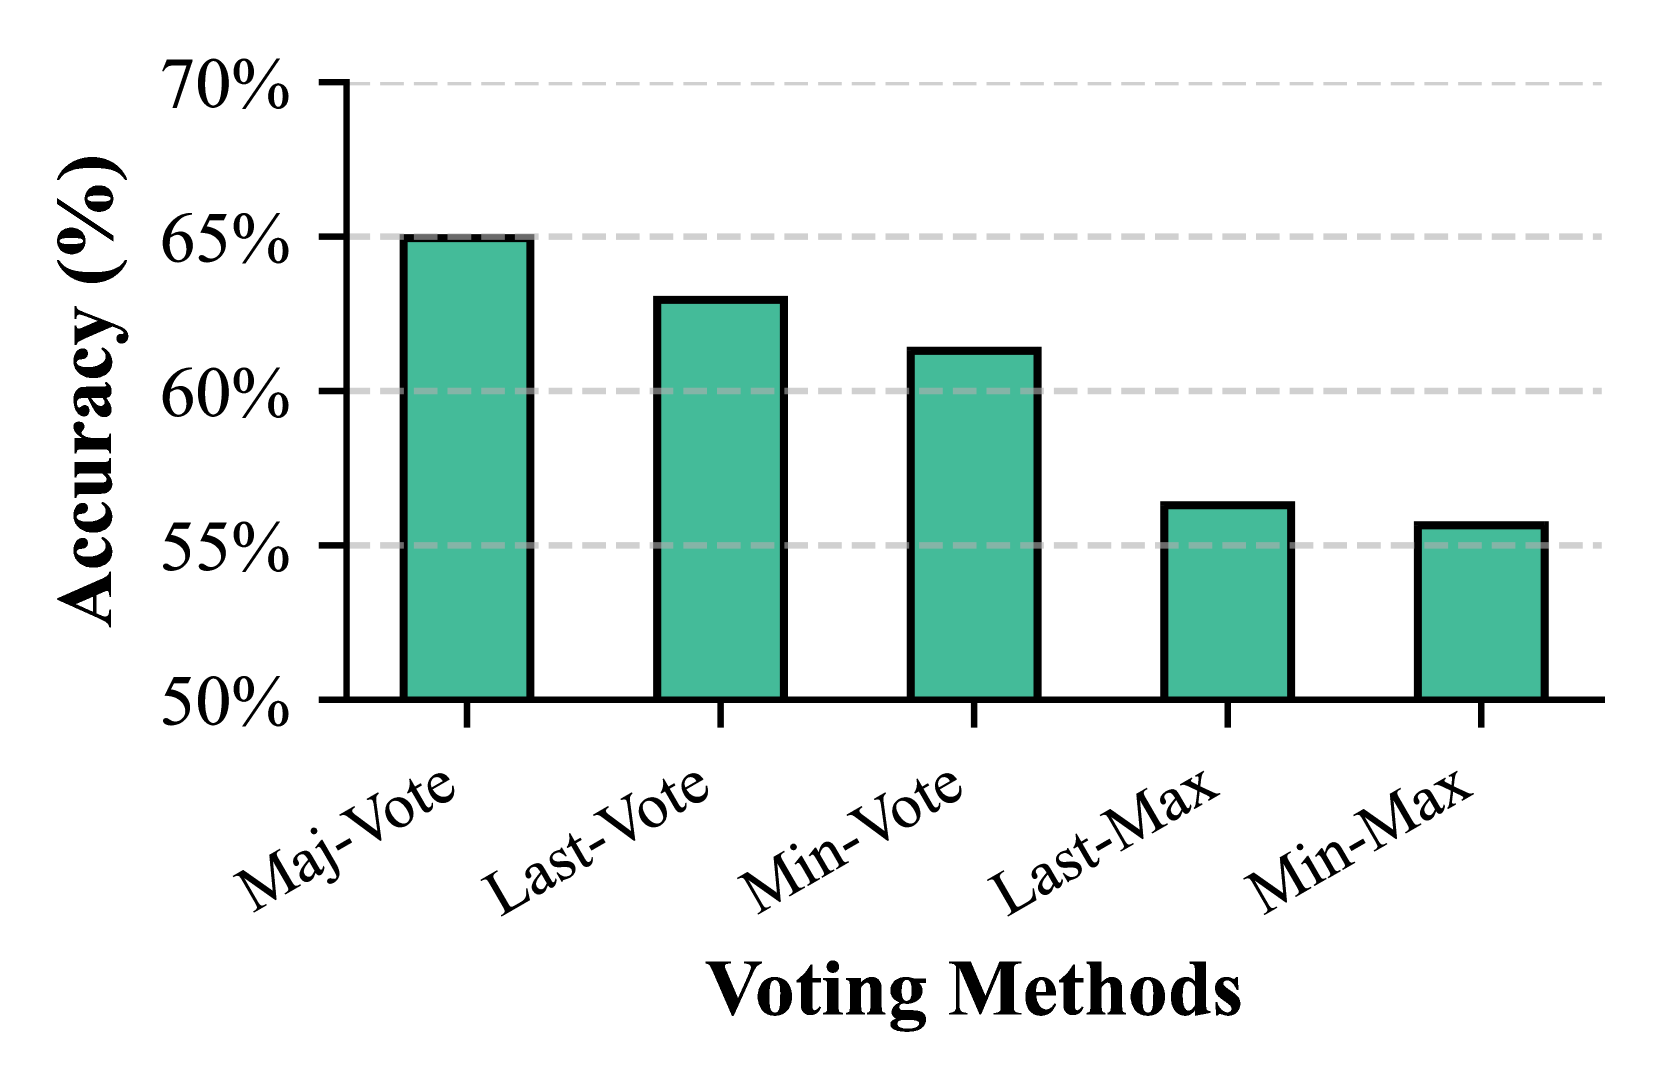
This image presents a bar chart comparing the accuracy of five different voting methods. The y-axis represents accuracy in percentage, while the x-axis lists the voting methods. Each method is represented by a green bar, with the height of the bar indicating the corresponding accuracy.
### Components/Axes
* **X-axis Label:** "Voting Methods"
* **Y-axis Label:** "Accuracy (%)"
* **Y-axis Scale:** Ranges from 50% to 70%, with tick marks at 55%, 60%, 65%, and 70%.
* **Voting Methods (Categories):**
* Maj-Vote
* Last-Vote
* Min-Vote
* Last-Max
* Min-Max
### Detailed Analysis
The chart displays the accuracy of each voting method as a vertical bar.
* **Maj-Vote:** The bar for Maj-Vote reaches approximately 65.5%.
* **Last-Vote:** The bar for Last-Vote reaches approximately 62.5%.
* **Min-Vote:** The bar for Min-Vote reaches approximately 60.5%.
* **Last-Max:** The bar for Last-Max reaches approximately 57.5%.
* **Min-Max:** The bar for Min-Max reaches approximately 55.5%.
The bars are arranged in order from left to right, corresponding to the order of the voting methods listed above. The height of each bar visually represents the accuracy percentage.
### Key Observations
* Maj-Vote exhibits the highest accuracy among the five methods.
* Min-Max demonstrates the lowest accuracy.
* There is a general decreasing trend in accuracy from Maj-Vote to Min-Max.
* The differences in accuracy between adjacent methods are relatively small, except for the drop from Last-Max to Min-Max.
### Interpretation
The data suggests that the "Maj-Vote" method is the most accurate among the tested voting methods, while "Min-Max" is the least accurate. The chart demonstrates a clear performance hierarchy, indicating that the choice of voting method can significantly impact the accuracy of the outcome. The decreasing trend suggests that methods prioritizing later votes or minimizing values may be less reliable. The relatively small differences between some methods (e.g., Maj-Vote and Last-Vote) suggest that the impact of the voting method might be less pronounced in certain scenarios. This data could be used to inform the selection of a voting method in applications where accuracy is a critical factor. The chart provides a direct comparison of the performance of these methods, allowing for a data-driven decision-making process.