\n
## Bar Chart: Comparison of Voting Method Accuracy
### Overview
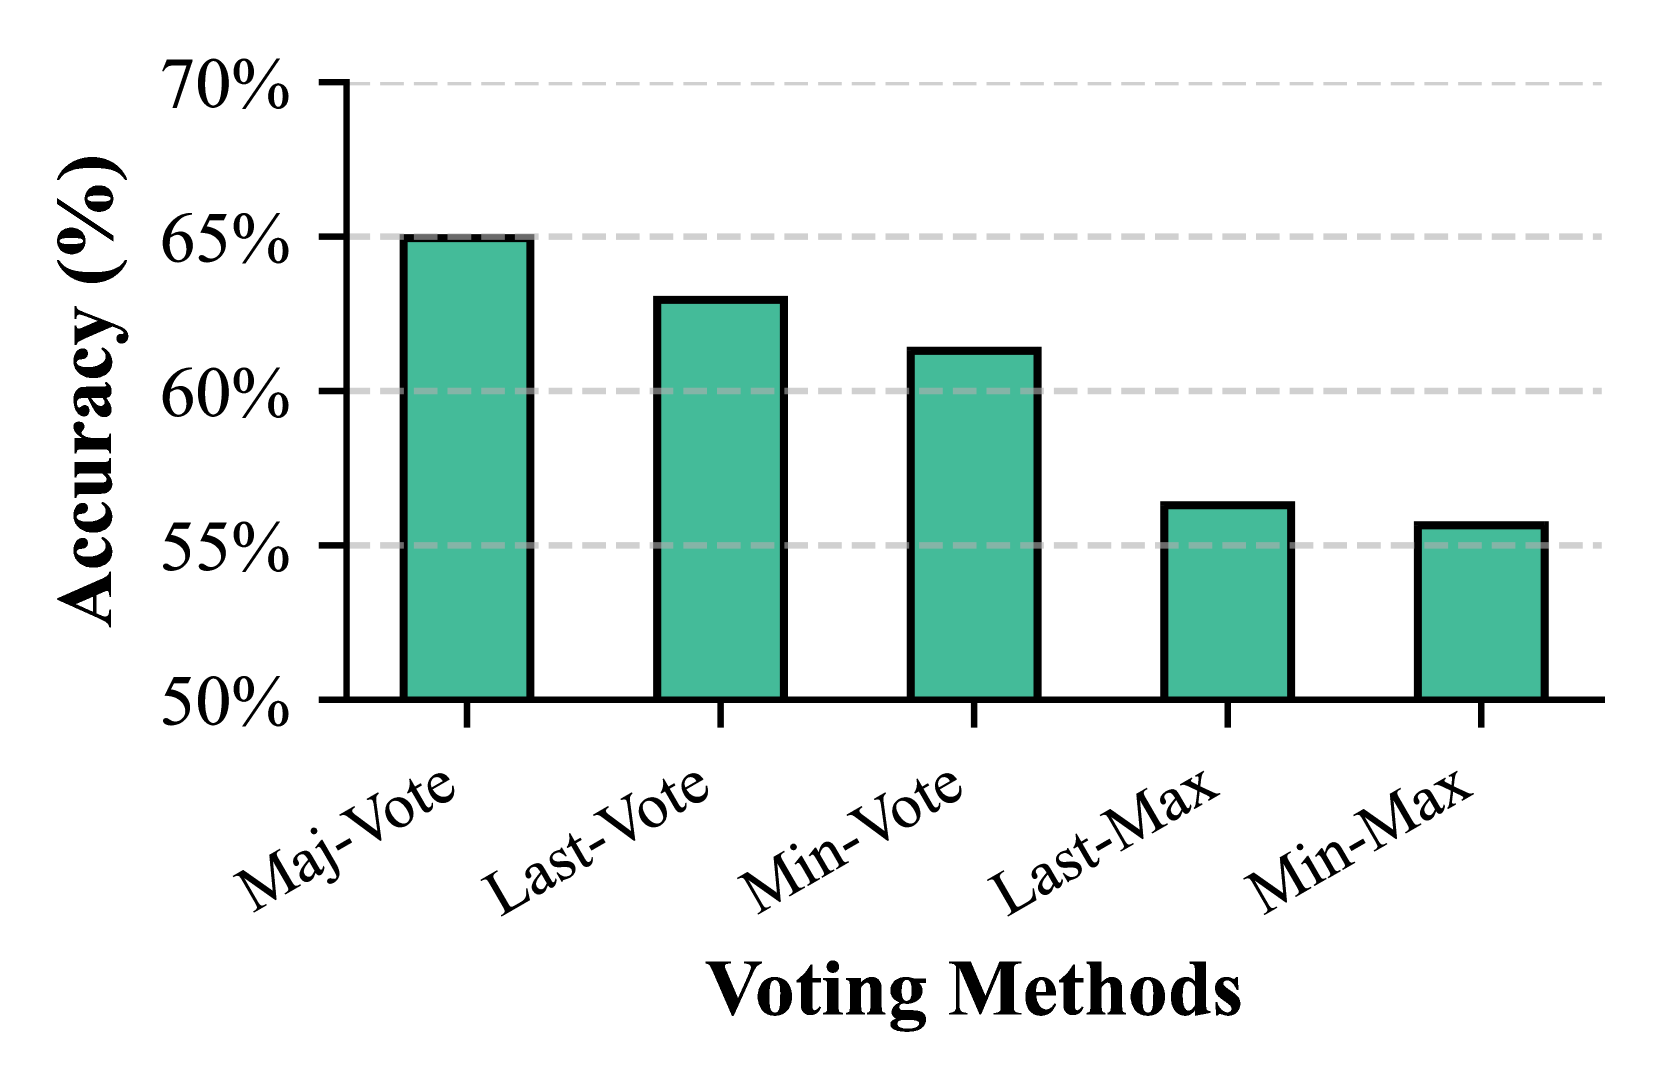
The image is a vertical bar chart comparing the accuracy percentages of five different voting methods. The chart displays a single data series with five bars, each representing a distinct method. The overall trend shows a decrease in accuracy from the leftmost to the rightmost method.
### Components/Axes
* **X-Axis (Horizontal):** Labeled **"Voting Methods"**. It contains five categorical labels, rotated at an angle for readability. From left to right, the categories are:
1. `Maj-Vote`
2. `Last-Vote`
3. `Min-Vote`
4. `Last-Max`
5. `Min-Max`
* **Y-Axis (Vertical):** Labeled **"Accuracy (%)"**. The scale is linear, ranging from 50% to 70%, with major tick marks and dashed horizontal grid lines at 5% intervals (50%, 55%, 60%, 65%, 70%).
* **Legend:** There is no separate legend. The chart uses a single color (a medium teal/green) for all bars, indicating they belong to the same data series measuring "Accuracy."
### Detailed Analysis
The chart presents the following approximate accuracy values for each voting method. Values are estimated based on the bar height relative to the y-axis grid lines.
1. **Maj-Vote (Leftmost bar):** This is the tallest bar. Its top aligns almost exactly with the 65% grid line.
* **Approximate Value:** 65%
* **Trend:** Highest accuracy in the set.
2. **Last-Vote (Second bar from left):** This bar is shorter than the first. Its top is positioned between the 60% and 65% grid lines, closer to 65%.
* **Approximate Value:** ~63%
* **Trend:** Slight decrease from Maj-Vote.
3. **Min-Vote (Third bar from left):** This bar is shorter than the second. Its top is just above the 60% grid line.
* **Approximate Value:** ~61%
* **Trend:** Continued decrease.
4. **Last-Max (Fourth bar from left):** This bar shows a more significant drop. Its top is just above the 55% grid line.
* **Approximate Value:** ~56%
* **Trend:** Notable decrease from the previous method.
5. **Min-Max (Rightmost bar):** This is the shortest bar. Its top is slightly above the 55% grid line, appearing marginally lower than the Last-Max bar.
* **Approximate Value:** ~55.5%
* **Trend:** Lowest accuracy in the set.
**Spatial Grounding & Trend Verification:** All bars are positioned directly above their respective x-axis labels. The visual trend is a clear, stepwise downward slope from left to right, confirming the numerical extraction that accuracy decreases across the sequence of methods presented.
### Key Observations
* **Clear Hierarchy:** There is a distinct performance hierarchy among the methods, with "Maj-Vote" being the most accurate and "Min-Max" being the least accurate in this comparison.
* **Two Performance Tiers:** The data suggests two groupings. The first three methods ("Maj-Vote," "Last-Vote," "Min-Vote") all achieve accuracy above 60%. The last two methods ("Last-Max," "Min-Max") cluster together with accuracy just above 55%.
* **Monotonic Decrease:** The accuracy decreases monotonically across the ordered categories as presented on the x-axis.
### Interpretation
This chart demonstrates a comparative analysis of ensemble or decision-combining strategies, likely in a machine learning or computational voting context. The data suggests that methods incorporating a "majority" principle (`Maj-Vote`) or a "last" element (`Last-Vote`) yield higher accuracy than methods based on "minimum" or "minimum-maximum" strategies (`Min-Vote`, `Last-Max`, `Min-Max`) for the specific task or dataset evaluated.
The significant drop between `Min-Vote` (~61%) and `Last-Max` (~56%) indicates a potential threshold where the underlying logic of the voting method changes substantially, leading to a notable performance penalty. The close performance of `Last-Max` and `Min-Max` suggests these two strategies, while distinct, result in similarly lower efficacy compared to the others. The chart effectively argues for the superiority of majority-based or recency-based voting in this particular scenario.