## Diagram: Illustration of a Region in a 2D Space
### Overview
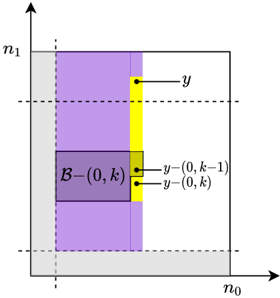
The image is a diagram illustrating a region within a two-dimensional space defined by axes labeled n0 and n1. The diagram includes several colored regions, points, and labels that define and describe the space.
### Components/Axes
* **Axes:**
* Horizontal axis: Labeled "n0" at the bottom-right.
* Vertical axis: Labeled "n1" at the top-left.
* **Regions:**
* Light gray region: Occupies the bottom and left sides of the diagram, extending to dashed lines.
* Purple region: A rectangular area in the center-left.
* Yellow region: A vertical strip to the right of the purple region.
* Overlapping region: A small area where the purple and yellow regions overlap, resulting in a darker color.
* **Points:**
* Point "y": Located in the upper-right part of the yellow region.
* Point "y-(0, k-1)": Located at the top of the overlapping region.
* Point "y-(0, k)": Located at the bottom of the overlapping region.
* **Labels:**
* "B-(0, k)": Label for the purple region.
### Detailed Analysis
* **Axes:** The axes n0 and n1 define a 2D space. The dashed lines indicate boundaries or limits within this space.
* **Regions:**
* The light gray region seems to represent a background or a broader space.
* The purple region, labeled "B-(0, k)", is a key area of interest. It is a rectangle.
* The yellow region is a vertical strip, possibly representing a specific range or condition along the n0 axis.
* The overlapping region indicates an intersection between the purple and yellow regions.
* **Points:**
* The point "y" is located within the yellow region.
* The points "y-(0, k-1)" and "y-(0, k)" are located at the top and bottom of the overlapping region, respectively. These points seem to be related to the purple region "B-(0, k)".
### Key Observations
* The diagram illustrates the spatial relationships between different regions and points within the n0-n1 space.
* The labels "B-(0, k)", "y-(0, k-1)", and "y-(0, k)" suggest a mathematical or algorithmic context, possibly related to iterative processes or transformations.
### Interpretation
The diagram likely represents a step or state within an iterative process or algorithm. The purple region "B-(0, k)" could represent a set or a state at iteration "k". The yellow region might represent a condition or a filter applied at that iteration. The points "y-(0, k-1)" and "y-(0, k)" could represent the state of "y" before and after applying the condition or filter at iteration "k". The diagram is a visual aid to understand the spatial relationships and transformations occurring within the algorithm.