## Pie Chart: KGoT Runtime Distribution
### Overview
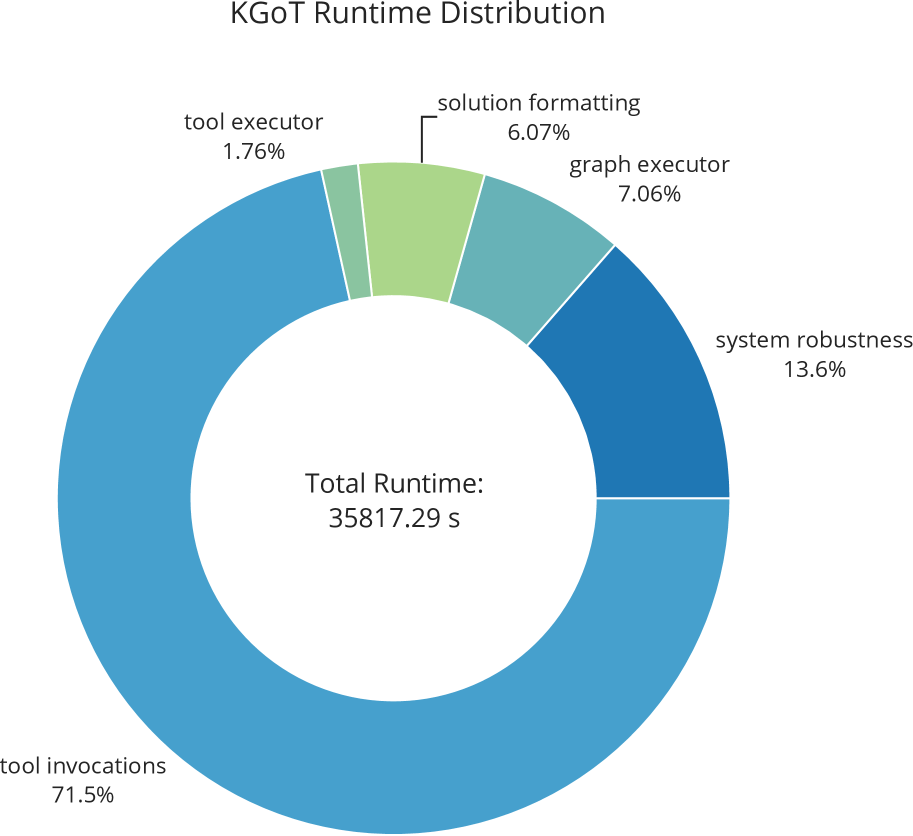
The chart visualizes the distribution of runtime across five components of the KGoT system, totaling **35,817.29 seconds**. The largest portion of runtime is allocated to "tool invocations," followed by "system robustness," "graph executor," "solution formatting," and "tool executor." Colors differentiate the components, with shades of blue and green used for clarity.
### Components/Axes
- **Title**: "KGoT Runtime Distribution"
- **Total Runtime**: 35,817.29 seconds (central text)
- **Legend**:
- **Colors**:
- Dark blue: "tool invocations"
- Medium blue: "system robustness"
- Teal: "graph executor"
- Green: "solution formatting"
- Light green: "tool executor"
- **Data Series**:
- Labels and percentages are embedded in each slice.
### Detailed Analysis
1. **Tool Invocations** (71.5%):
- Dominates the chart, occupying the largest slice (dark blue).
- Corresponds to **25,633.5 seconds** (71.5% of 35,817.29).
2. **System Robustness** (13.6%):
- Second-largest slice (medium blue), representing **4,811.2 seconds**.
3. **Graph Executor** (7.06%):
- Teal slice, accounting for **2,528.5 seconds**.
4. **Solution Formatting** (6.07%):
- Green slice, representing **2,173.5 seconds**.
5. **Tool Executor** (1.76%):
- Smallest slice (light green), contributing **611.5 seconds**.
### Key Observations
- **Tool invocations** consume over **70%** of total runtime, indicating a critical area for optimization.
- "System robustness" and "graph executor" together account for ~20% of runtime, suggesting secondary focus areas.
- "Tool executor" is the smallest contributor (<2%), potentially indicating inefficiency or underutilization.
### Interpretation
The data highlights that **tool invocations** are the primary runtime bottleneck, consuming the majority of processing time. This suggests that optimizing tool invocation mechanisms (e.g., reducing overhead, parallelizing tasks) could significantly improve overall system performance. The smaller contributions from "graph executor" and "solution formatting" imply these components are relatively efficient but may still offer marginal gains. The minimal runtime for "tool executor" raises questions about its role—whether it is intentionally lightweight or underutilized. The chart underscores the need for targeted optimization in high-impact areas to achieve runtime efficiency.