## Bar Chart: R1-Llama | GPQA-D
### Overview
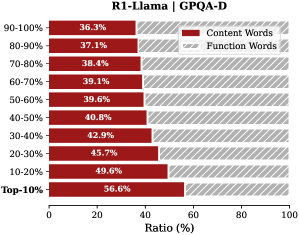
This is a horizontal bar chart comparing the ratio of Content Words to Function Words across different performance percentiles (Top-10% to 90-100%) for R1-Llama on the GPQA-D dataset. The chart shows how the proportion of content words changes as performance increases.
### Components/Axes
* **Title:** R1-Llama | GPQA-D
* **Y-axis (Vertical):** Performance Percentiles (Top-10%, 10-20%, 20-30%, 30-40%, 40-50%, 50-60%, 60-70%, 70-80%, 80-90%, 90-100%)
* **X-axis (Horizontal):** Ratio (%) from 0 to 100
* **Legend (Top-Right):**
* Content Words (Dark Red)
* Function Words (Light Gray with diagonal lines)
### Detailed Analysis
The chart displays the ratio of Content Words and Function Words for each performance percentile.
* **Top-10%:** Content Words: 56.6%, Function Words: 43.4% (estimated)
* **10-20%:** Content Words: 49.6%, Function Words: 50.4% (estimated)
* **20-30%:** Content Words: 45.7%, Function Words: 54.3% (estimated)
* **30-40%:** Content Words: 42.9%, Function Words: 57.1% (estimated)
* **40-50%:** Content Words: 40.8%, Function Words: 59.2% (estimated)
* **50-60%:** Content Words: 39.6%, Function Words: 60.4% (estimated)
* **60-70%:** Content Words: 39.1%, Function Words: 60.9% (estimated)
* **70-80%:** Content Words: 38.4%, Function Words: 61.6% (estimated)
* **80-90%:** Content Words: 37.1%, Function Words: 62.9% (estimated)
* **90-100%:** Content Words: 36.3%, Function Words: 63.7% (estimated)
**Trend:** As the performance percentile increases (from 90-100% to Top-10%), the ratio of Content Words increases, while the ratio of Function Words decreases.
### Key Observations
* The "Top-10%" percentile has the highest proportion of Content Words (56.6%).
* The "90-100%" percentile has the lowest proportion of Content Words (36.3%).
* There is a clear inverse relationship between performance percentile and the ratio of Function Words.
### Interpretation
The data suggests that higher-performing instances of R1-Llama on the GPQA-D dataset tend to use a greater proportion of Content Words compared to Function Words. This could indicate that better performance is associated with more direct and informative language, while lower performance might involve more filler words or less precise phrasing. The chart highlights the importance of content-rich language in achieving better results on this particular task.