## Line Chart: Accuracy vs. Thinking Compute
### Overview
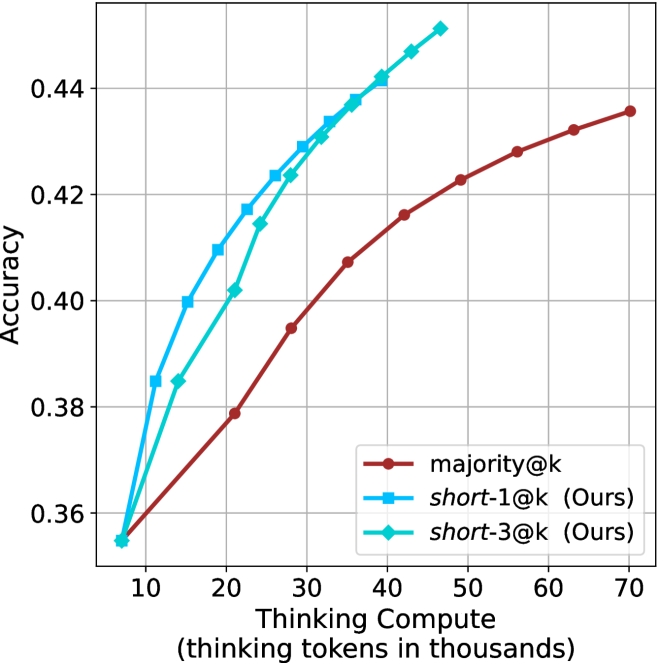
The image is a line chart comparing the accuracy of three different models ("majority@k", "short-1@k (Ours)", and "short-3@k (Ours)") as a function of "Thinking Compute" (measured in thousands of thinking tokens). The chart displays how accuracy increases with increasing computational resources for each model.
### Components/Axes
* **X-axis:** "Thinking Compute (thinking tokens in thousands)". The axis ranges from approximately 5 to 70, with tick marks at intervals of 10 (10, 20, 30, 40, 50, 60, 70).
* **Y-axis:** "Accuracy". The axis ranges from 0.36 to 0.44, with gridlines at intervals of 0.02 (0.36, 0.38, 0.40, 0.42, 0.44).
* **Legend:** Located in the bottom-right corner of the chart.
* **Brown line with circle markers:** "majority@k"
* **Blue line with square markers:** "short-1@k (Ours)"
* **Cyan line with diamond markers:** "short-3@k (Ours)"
### Detailed Analysis
* **majority@k (Brown line with circle markers):** The line starts at approximately (8, 0.357) and increases to (70, 0.435). The slope decreases as the Thinking Compute increases, indicating diminishing returns in accuracy with more compute.
* **short-1@k (Ours) (Blue line with square markers):** The line starts at approximately (8, 0.355) and increases to (45, 0.445). The slope is steeper than "majority@k" at lower Thinking Compute values.
* **short-3@k (Ours) (Cyan line with diamond markers):** The line starts at approximately (8, 0.355) and increases to (45, 0.450). The slope is similar to "short-1@k (Ours)" at lower Thinking Compute values.
### Key Observations
* All three models show an increase in accuracy as Thinking Compute increases.
* The "short-1@k (Ours)" and "short-3@k (Ours)" models outperform "majority@k" at lower Thinking Compute values.
* The "short-3@k (Ours)" model has a slightly higher accuracy than "short-1@k (Ours)" for most of the observed range.
* The rate of accuracy increase diminishes for all models as Thinking Compute increases, suggesting a point of diminishing returns.
### Interpretation
The chart suggests that the "short-1@k (Ours)" and "short-3@k (Ours)" models are more efficient in terms of accuracy gained per unit of Thinking Compute, especially at lower compute levels, compared to the "majority@k" model. This could indicate that the "short-1@k" and "short-3@k" models are better optimized or more effective at utilizing computational resources. The diminishing returns observed for all models indicate that there is a limit to how much accuracy can be gained by simply increasing Thinking Compute. Further investigation might explore alternative optimization strategies or model architectures to overcome this limitation.