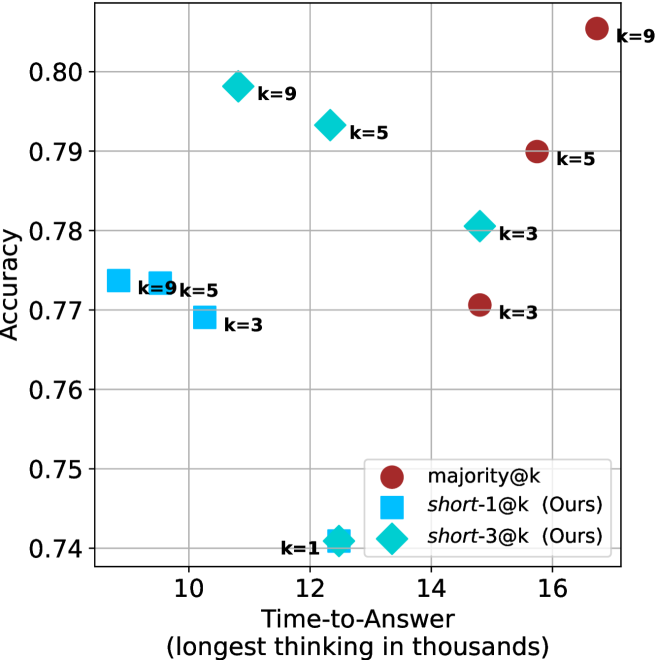
## Scatter Plot: Accuracy vs. Time-to-Answer
### Overview
The image is a scatter plot comparing the accuracy of different methods (majority@k, short-1@k, and short-3@k) against the time-to-answer. The x-axis represents the time-to-answer (longest thinking in thousands), and the y-axis represents accuracy. Each data point is labeled with a 'k' value, indicating a parameter used in the method.
### Components/Axes
* **X-axis:** Time-to-Answer (longest thinking in thousands). Scale ranges from approximately 9 to 17.
* **Y-axis:** Accuracy. Scale ranges from 0.74 to 0.80.
* **Legend (bottom-right):**
* Red circle: majority@k
* Blue square: short-1@k (Ours)
* Teal diamond: short-3@k (Ours)
* **Data Points:** Each point is labeled with its corresponding 'k' value.
### Detailed Analysis
**1. majority@k (Red Circles):**
* Trend: Accuracy generally increases with time-to-answer.
* k=3: Time-to-Answer ≈ 15, Accuracy ≈ 0.77
* k=5: Time-to-Answer ≈ 15.7, Accuracy ≈ 0.79
* k=9: Time-to-Answer ≈ 16.7, Accuracy ≈ 0.81
**2. short-1@k (Blue Squares):**
* Trend: Accuracy is relatively stable for k=3, k=5, and k=9, with a significant drop for k=1.
* k=9, k=5: Time-to-Answer ≈ 9.8, Accuracy ≈ 0.77
* k=3: Time-to-Answer ≈ 10.5, Accuracy ≈ 0.77
* k=1: No data point present
**3. short-3@k (Teal Diamonds):**
* Trend: Accuracy increases with time-to-answer.
* k=1: Time-to-Answer ≈ 12, Accuracy ≈ 0.74
* k=3: Time-to-Answer ≈ 13.7, Accuracy ≈ 0.78
* k=5: Time-to-Answer ≈ 13, Accuracy ≈ 0.793
* k=9: Time-to-Answer ≈ 11.5, Accuracy ≈ 0.798
### Key Observations
* The majority@k method shows a clear positive correlation between time-to-answer and accuracy.
* The short-1@k method has similar accuracy for k=3, k=5, and k=9, but no data is present for k=1.
* The short-3@k method also shows a positive correlation between time-to-answer and accuracy.
* For the short-1@k method, the data points for k=9 and k=5 are overlapping.
### Interpretation
The scatter plot compares the performance of three different methods (majority@k, short-1@k, and short-3@k) in terms of accuracy and time-to-answer. The 'k' value likely represents a parameter that influences the method's behavior.
The data suggests that increasing the time-to-answer generally improves the accuracy of the majority@k and short-3@k methods. The short-1@k method appears to have a stable accuracy for higher 'k' values (3, 5, and 9). The absence of a data point for k=1 in the short-1@k method might indicate a limitation or inapplicability of the method for that specific parameter value.
The plot allows for a direct comparison of the trade-offs between accuracy and time-to-answer for each method and 'k' value. For example, one can observe that the majority@k method achieves the highest accuracy but also requires the longest time-to-answer.