## Scatter Plot: Accuracy vs. Time-to-Answer
### Overview
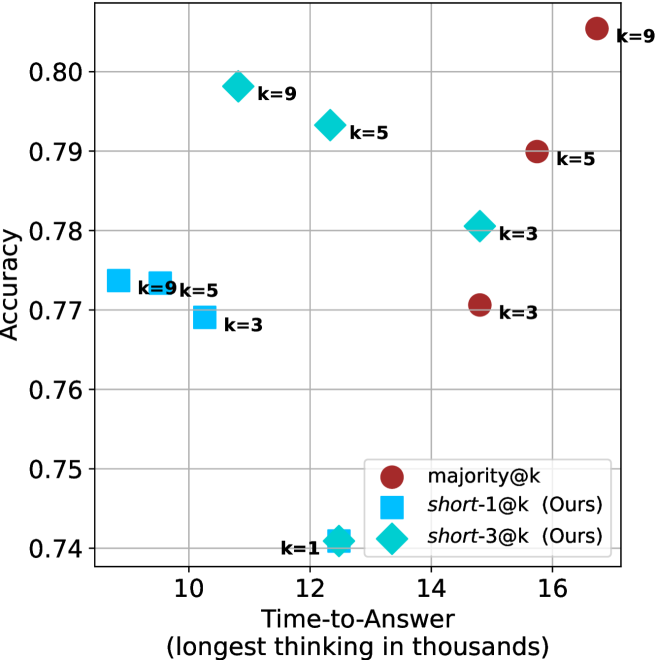
This image is a scatter plot comparing the performance of three different methods—`majority@k`, `short-1@k` (Ours), and `short-3@k` (Ours)—based on their "Accuracy" (y-axis) and "Time-to-Answer" (x-axis). The x-axis represents the "longest thinking in thousands." The plot demonstrates a trade-off between computational time and model accuracy across different values of *k*.
### Components/Axes
* **Y-Axis:** Labeled "Accuracy." The scale ranges from 0.74 to 0.80, with grid lines at 0.01 intervals.
* **X-Axis:** Labeled "Time-to-Answer (longest thinking in thousands)." The scale ranges from 10 to 16, with grid lines at 2-unit intervals.
* **Legend:** Located in the bottom-right quadrant.
* **Dark Red Circle:** `majority@k`
* **Light Blue Square:** `short-1@k (Ours)`
* **Teal Diamond:** `short-3@k (Ours)`
* **Data Markers:** The plot uses specific shapes (circles, squares, diamonds, and one star) to represent data points, each labeled with its corresponding *k* value.
### Detailed Analysis
The following data points are approximate based on visual estimation from the grid:
**1. `majority@k` (Dark Red Circles)**
* *Trend:* Positive correlation. As *k* increases, both time and accuracy increase significantly.
* *k=3:* (x ≈ 14.8, y ≈ 0.771)
* *k=5:* (x ≈ 15.8, y ≈ 0.790)
* *k=9:* (x ≈ 16.8, y ≈ 0.806)
**2. `short-3@k` (Teal Diamonds)**
* *Trend:* Negative correlation between time and accuracy. As *k* increases, the time-to-answer decreases while accuracy increases, suggesting higher efficiency.
* *k=3:* (x ≈ 14.8, y ≈ 0.781)
* *k=5:* (x ≈ 12.0, y ≈ 0.793)
* *k=9:* (x ≈ 11.0, y ≈ 0.798)
**3. `short-1@k` (Light Blue Squares)**
* *Trend:* Relatively flat accuracy with a slight increase in time as *k* increases.
* *k=3:* (x ≈ 10.3, y ≈ 0.769)
* *k=5:* (x ≈ 9.8, y ≈ 0.774)
* *k=9:* (x ≈ 9.5, y ≈ 0.774)
**4. Unlabeled Anomaly (Teal Star)**
* *Marker:* A teal star-shaped marker is located at (x ≈ 12.5, y ≈ 0.741), labeled "k=1." This marker is not explicitly defined in the legend, though its color matches the `short-3@k` series.
### Key Observations
* **Efficiency Leader:** The `short-3@k` series demonstrates the most desirable performance characteristics, achieving high accuracy (comparable to `majority@k`) while requiring significantly less time as *k* increases.
* **Performance Ceiling:** `majority@k` achieves the highest absolute accuracy (at k=9), but it is also the most computationally expensive method.
* **Efficiency Floor:** `short-1@k` is the fastest method (lowest time-to-answer) but consistently yields lower accuracy than the other two methods.
* **The "k=1" Outlier:** The star-shaped marker at k=1 represents the lowest accuracy point on the chart, suggesting that a very low *k* value is suboptimal for this specific task.
### Interpretation
The data suggests that the "Ours" methods (`short-1` and `short-3`) are optimized for computational efficiency compared to the `majority@k` baseline.
Specifically, `short-3@k` appears to be the superior configuration. It exhibits an inverse relationship between time and accuracy—as *k* increases, it becomes both faster and more accurate. This is a highly efficient scaling behavior. In contrast, `majority@k` forces a trade-off where higher accuracy is only achievable by incurring significantly higher time costs. The `short-1@k` method is the fastest but hits a performance plateau, suggesting it may not be complex enough to capture the necessary information for higher accuracy.