\n
## Line Charts: Effect of Heads Kept on Explained Effect for Different Models
### Overview
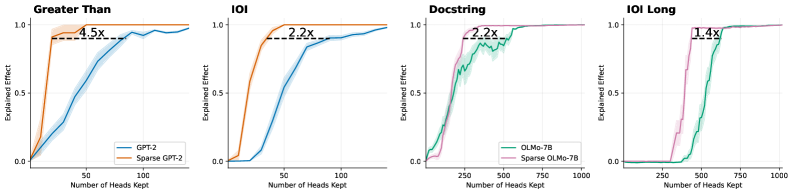
The image presents four line charts, each comparing the "Explained Effect" of two different models as the "Number of Heads Kept" increases. Each chart focuses on a different evaluation metric: "Greater Than", "IOI", "Docstring", and "IOI Long". The charts visually demonstrate how much of the effect is retained as the number of attention heads is reduced.
### Components/Axes
Each chart shares the following components:
* **X-axis:** "Number of Heads Kept" - ranging from approximately 0 to 1000.
* **Y-axis:** "Explained Effect" - ranging from 0.0 to 1.0.
* **Titles:** Each chart has a title indicating the evaluation metric used ("Greater Than", "IOI", "Docstring", "IOI Long").
* **Legends:** Each chart has a legend identifying the two models being compared.
The specific models and legend colors are as follows:
* **Chart 1 ("Greater Than"):**
* GPT-2 (Blue)
* Sparse GPT-2 (Orange)
* **Chart 2 ("IOI"):**
* GPT-2 (Blue)
* Sparse GPT-2 (Orange)
* **Chart 3 ("Docstring"):**
* OLMo-7B (Green)
* Sparse OLMo-7B (Pink)
* **Chart 4 ("IOI Long"):**
* OLMo-7B (Green)
* Sparse OLMo-7B (Pink)
Each chart also includes a vertical dashed line with a text label indicating a performance ratio (e.g., "4.5x", "2.2x").
### Detailed Analysis or Content Details
**Chart 1: Greater Than**
* **GPT-2 (Blue):** The line starts at approximately 0.0 at 0 heads kept, rises rapidly to around 0.8 by 50 heads kept, and plateaus around 0.95-1.0 from approximately 75 heads kept onwards.
* **Sparse GPT-2 (Orange):** The line starts at approximately 0.0 at 0 heads kept, rises more gradually than GPT-2, reaching around 0.7 by 50 heads kept, and plateaus around 0.8-0.9 from approximately 75 heads kept onwards.
* The dashed line is positioned at approximately 75 heads kept and labeled "4.5x".
**Chart 2: IOI**
* **GPT-2 (Blue):** The line starts at approximately 0.0 at 0 heads kept, rises rapidly to around 0.8 by 50 heads kept, and plateaus around 0.95-1.0 from approximately 75 heads kept onwards.
* **Sparse GPT-2 (Orange):** The line starts at approximately 0.0 at 0 heads kept, rises more gradually than GPT-2, reaching around 0.7 by 50 heads kept, and plateaus around 0.8-0.9 from approximately 75 heads kept onwards.
* The dashed line is positioned at approximately 50 heads kept and labeled "2.2x".
**Chart 3: Docstring**
* **OLMo-7B (Green):** The line starts at approximately 0.0 at 250 heads kept, rises rapidly to around 0.8 by 750 heads kept, and plateaus around 0.9-1.0 from approximately 750 heads kept onwards.
* **Sparse OLMo-7B (Pink):** The line starts at approximately 0.0 at 250 heads kept, rises more slowly than OLMo-7B, reaching around 0.6 by 750 heads kept, and plateaus around 0.7-0.8 from approximately 750 heads kept onwards.
* The dashed line is positioned at approximately 750 heads kept and labeled "2.2x".
**Chart 4: IOI Long**
* **OLMo-7B (Green):** The line starts at approximately 0.0 at 250 heads kept, rises rapidly to around 0.8 by 750 heads kept, and plateaus around 0.9-1.0 from approximately 750 heads kept onwards.
* **Sparse OLMo-7B (Pink):** The line starts at approximately 0.0 at 250 heads kept, rises more slowly than OLMo-7B, reaching around 0.6 by 750 heads kept, and plateaus around 0.7-0.8 from approximately 750 heads kept onwards.
* The dashed line is positioned at approximately 750 heads kept and labeled "1.4x".
### Key Observations
* In all four charts, the "Sparse" model consistently exhibits a lower "Explained Effect" than its non-sparse counterpart for a given number of heads kept.
* The performance gap between the models appears to diminish as the number of heads kept increases, but the sparse models never fully catch up.
* The "Greater Than" and "IOI" metrics show a more pronounced difference between GPT-2 and Sparse GPT-2 than the "Docstring" and "IOI Long" metrics show between OLMo-7B and Sparse OLMo-7B.
* The dashed lines indicate the relative improvement achieved by the non-sparse model over the sparse model at a specific number of heads kept.
### Interpretation
These charts demonstrate the trade-off between model size (number of heads) and performance (explained effect). Reducing the number of heads (sparsity) leads to a decrease in explained effect, but it also potentially reduces computational cost and memory requirements. The "x" values (4.5x, 2.2x, 2.2x, 1.4x) represent the factor by which the non-sparse model outperforms the sparse model at the indicated number of heads kept.
The differences in the magnitude of these factors across the different evaluation metrics suggest that the impact of sparsity varies depending on the task. "Greater Than" and "IOI" seem to be more sensitive to sparsity than "Docstring" and "IOI Long". This could indicate that the sparse models retain more of their capabilities for tasks requiring more complex reasoning or understanding of long-range dependencies.
The charts suggest that while sparsity can be a useful technique for model compression, it comes at a cost in terms of performance. The optimal level of sparsity will depend on the specific application and the desired balance between performance and efficiency. The dashed lines provide a visual guide for understanding the performance trade-offs at different sparsity levels.