## Line Graph: Normalization Angle Circular Distributions across Time-steps
### Overview
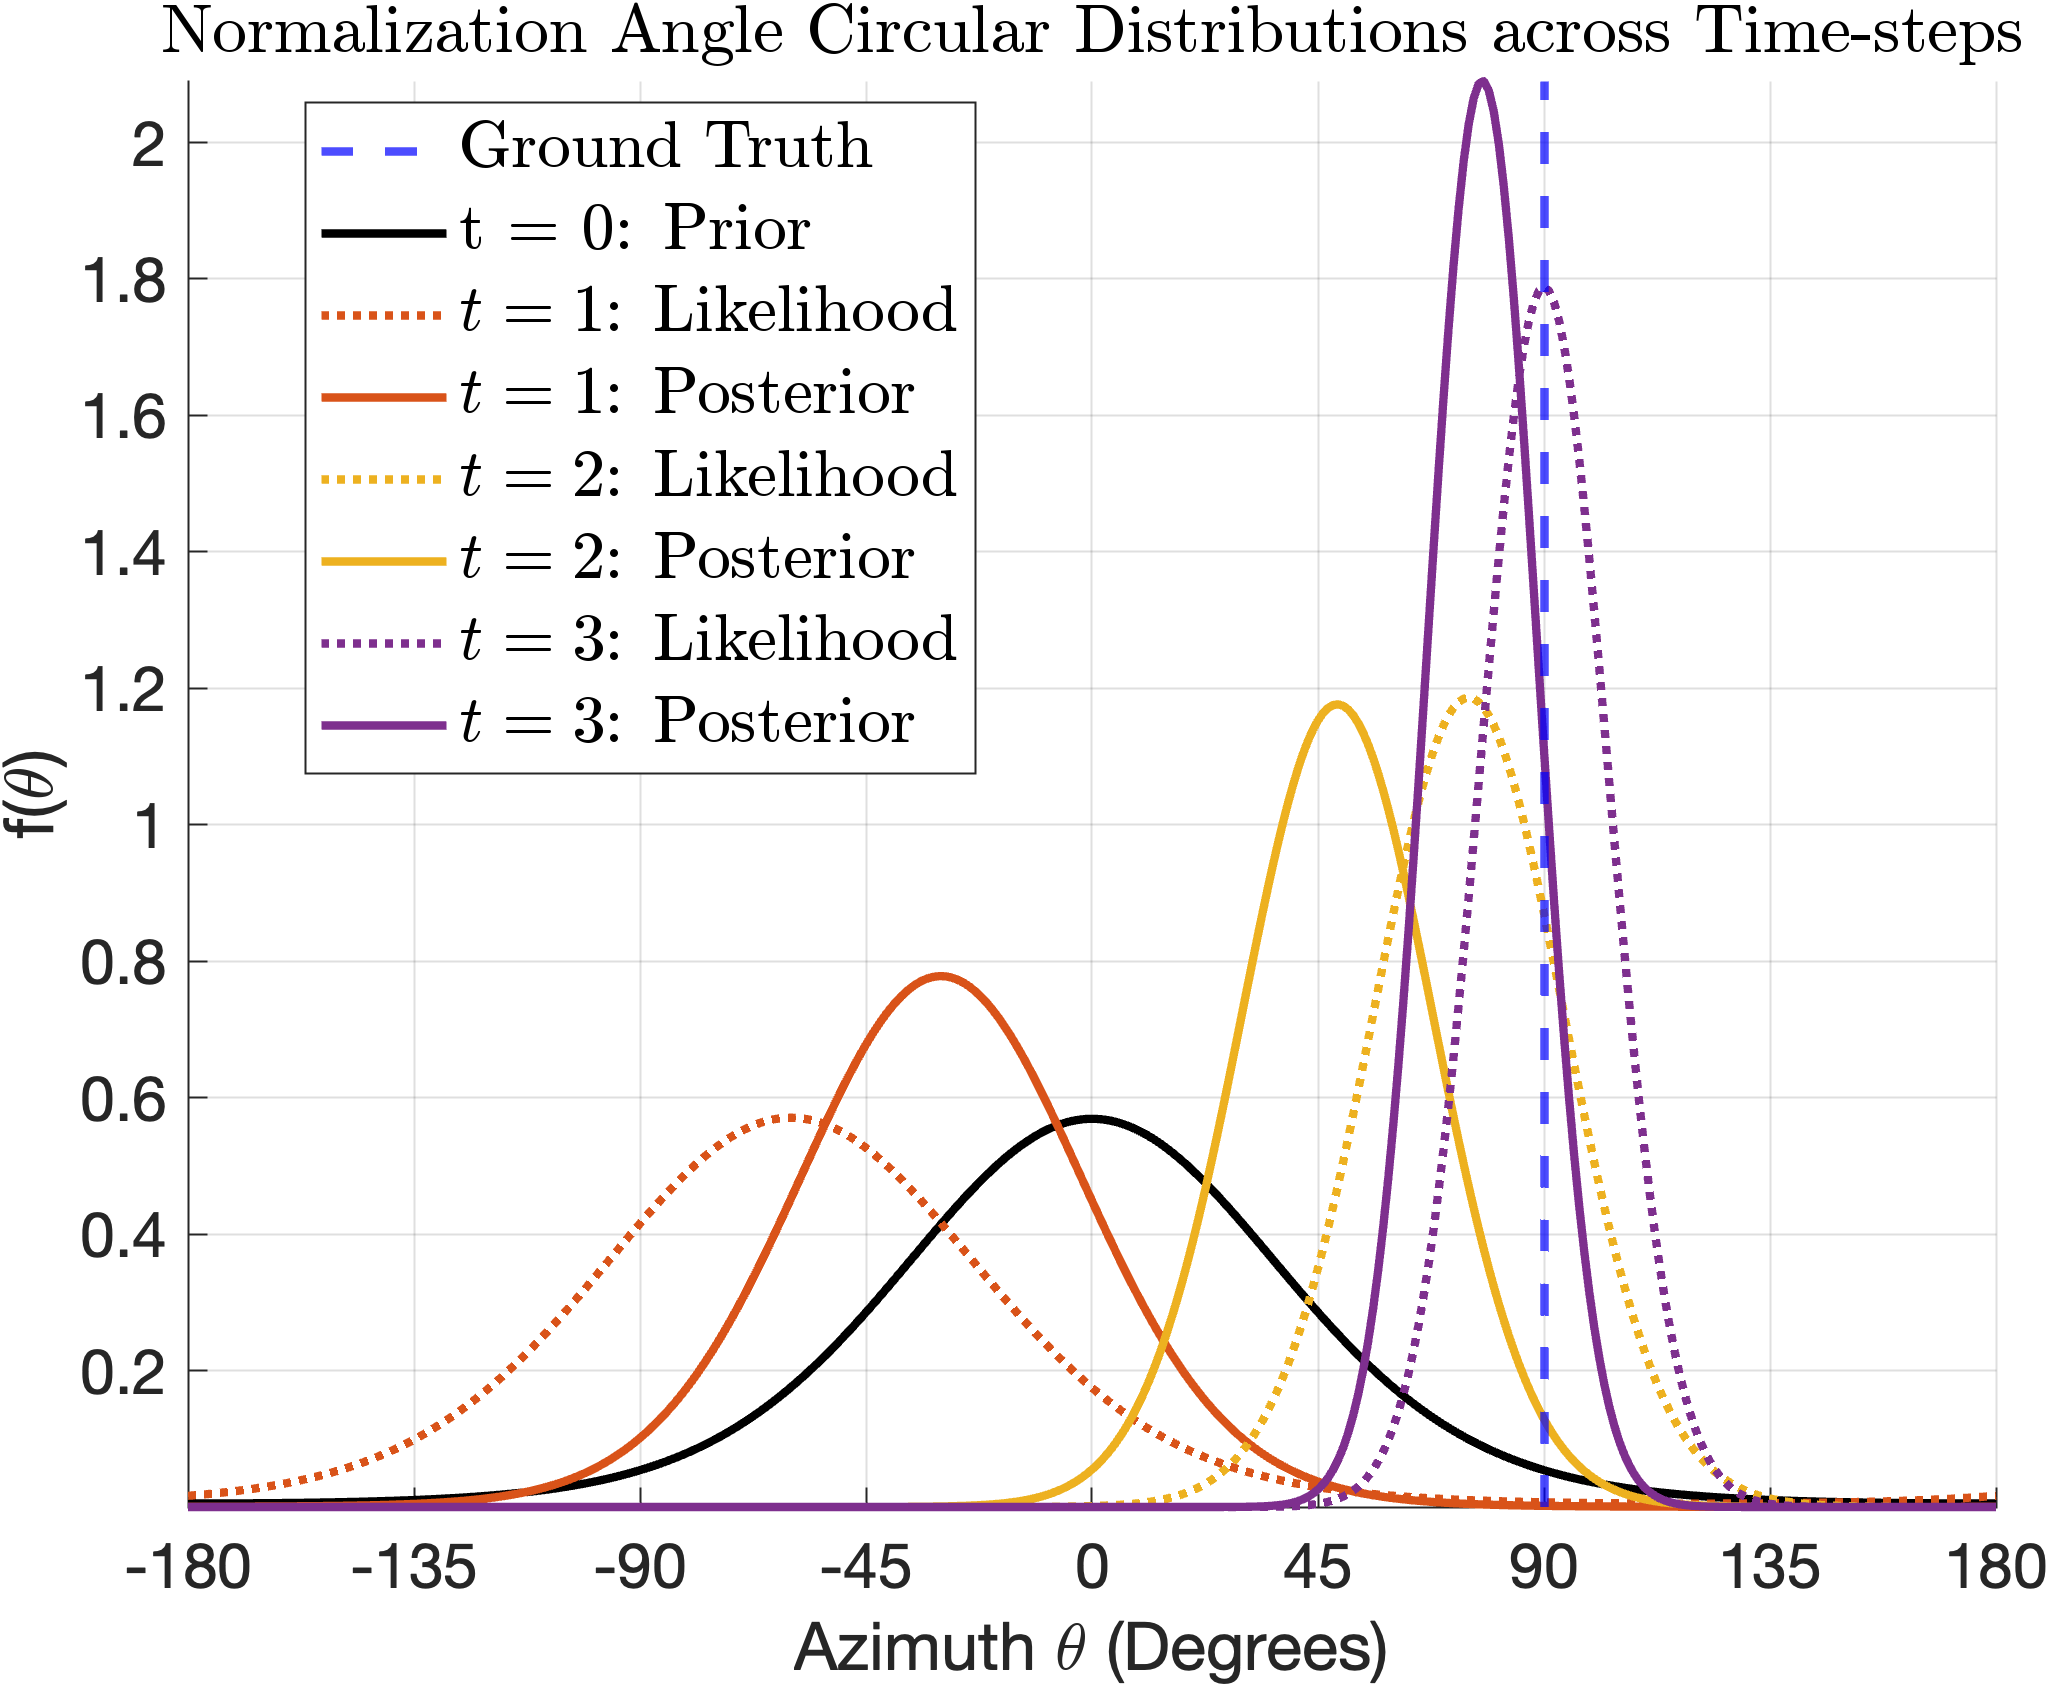
The graph depicts the evolution of normalized angle distributions (f(θ)) across four time-steps (t=0 to t=3), comparing prior, likelihood, and posterior estimates against a ground truth. Distributions are plotted against azimuth angles (θ) in degrees, with distinct line styles and colors for each data series.
### Components/Axes
- **X-axis**: Azimuth θ (Degrees), ranging from -180° to 180° in 45° increments.
- **Y-axis**: Normalized frequency f(θ), scaled from 0 to 2.
- **Legend**: Located in the top-right corner, mapping colors and line styles to time-steps and distribution types:
- **Blue dashed**: Ground Truth
- **Black solid**: t=0: Prior
- **Red dotted**: t=1: Likelihood
- **Red solid**: t=1: Posterior
- **Orange dotted**: t=2: Likelihood
- **Orange solid**: t=2: Posterior
- **Purple dotted**: t=3: Likelihood
- **Purple solid**: t=3: Posterior
### Detailed Analysis
1. **Ground Truth (Blue Dashed Line)**:
- Peaks sharply at θ ≈ 90° with f(θ) ≈ 2.0.
- Symmetric decline to near-zero values at θ = ±180°.
2. **t=0: Prior (Black Solid Line)**:
- Broad, low-peak distribution centered at θ ≈ 0°.
- f(θ) ≈ 0.6 at peak, tapering symmetrically to ±180°.
3. **t=1: Likelihood (Red Dotted Line)**:
- Narrower than prior, centered at θ ≈ 0°.
- f(θ) ≈ 0.8 at peak, with sharper decline.
4. **t=1: Posterior (Red Solid Line)**:
- Shifted toward θ ≈ 45°, f(θ) ≈ 1.0.
- Asymmetric shape with a secondary peak near θ ≈ 90°.
5. **t=2: Likelihood (Orange Dotted Line)**:
- Further narrowed, centered at θ ≈ 45°.
- f(θ) ≈ 1.2 at peak, with reduced spread.
6. **t=2: Posterior (Orange Solid Line)**:
- Dominant peak at θ ≈ 90°, f(θ) ≈ 1.8.
- Minimal presence at θ < 45°.
7. **t=3: Likelihood (Purple Dotted Line)**:
- Very narrow, centered at θ ≈ 90°.
- f(θ) ≈ 2.0 at peak, nearly matching ground truth.
8. **t=3: Posterior (Purple Solid Line)**:
- Sharpest distribution, f(θ) ≈ 2.0 at θ ≈ 90°.
- Overlaps almost entirely with ground truth.
### Key Observations
- **Convergence**: Posterior distributions (solid lines) progressively align with the ground truth as t increases.
- **Likelihood vs. Posterior**: Likelihoods (dotted lines) are broader and less peaked than posteriors, reflecting uncertainty before Bayesian updating.
- **Peak Shift**: The posterior peak shifts from θ ≈ 0° (t=0) to θ ≈ 90° (t=3), mirroring the ground truth.
- **Symmetry**: Early time-steps (t=0, t=1) show symmetric distributions, while later steps (t=2, t=3) exhibit asymmetry favoring θ ≈ 90°.
### Interpretation
The graph demonstrates iterative Bayesian updating, where prior assumptions (t=0) are refined through likelihood calculations and posterior updates. By t=3, the model’s posterior distribution closely matches the ground truth, indicating high confidence in the angle estimate. The likelihood distributions represent intermediate uncertainty, while posteriors incorporate prior knowledge to sharpen estimates. The sharp peak at θ ≈ 90° suggests a strong signal or constraint in the data favoring this angle. The asymmetry in later posteriors implies potential biases or directional dependencies in the data.