## Stacked Bar Chart: Pythia 6.9B Layer-wise Head Distribution
### Overview
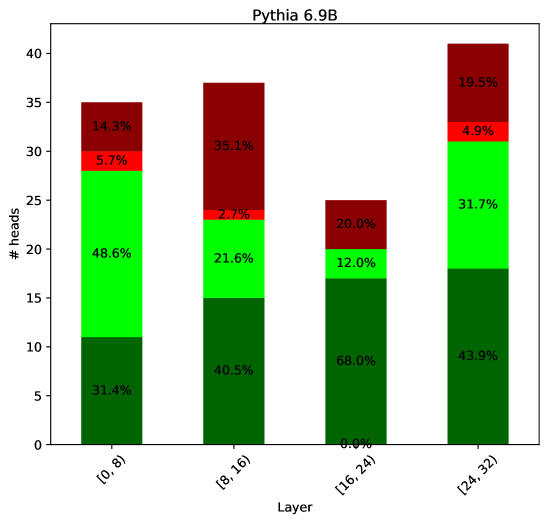
This is a stacked bar chart titled "Pythia 6.9B". It displays the distribution of a metric (likely attention heads) across four different layer ranges of a neural network model. The y-axis represents the count ("#heads"), and the x-axis represents the "Layer" ranges. Each bar is segmented into four colored categories, with the percentage of the total for that bar labeled within each segment.
### Components/Axes
* **Title:** "Pythia 6.9B"
* **Y-axis:** Label: "#heads". Scale: 0 to 40, with major ticks at intervals of 5.
* **X-axis:** Label: "Layer". Categories (from left to right):
1. `[0, 8)`
2. `[8, 16)`
3. `[16, 24)`
4. `[24, 32)`
* **Legend:** Not explicitly shown. The four colors used in the bars represent distinct categories. Based on consistent color use across bars, the categories are:
* **Dark Green** (bottom segment)
* **Bright Green** (second segment from bottom)
* **Red** (third segment from bottom)
* **Dark Red** (top segment)
### Detailed Analysis
The chart presents the composition of "#heads" for each layer range. The total height of each bar represents the total number of heads in that layer range. The segments show the proportion of each category within that total.
**Bar 1: Layer Range [0, 8)**
* **Total Height (Approximate):** 35 heads
* **Segment Breakdown (from bottom to top):**
* **Dark Green:** 31.4% (≈11 heads)
* **Bright Green:** 48.6% (≈17 heads)
* **Red:** 5.7% (≈2 heads)
* **Dark Red:** 14.3% (≈5 heads)
**Bar 2: Layer Range [8, 16)**
* **Total Height (Approximate):** 37 heads
* **Segment Breakdown (from bottom to top):**
* **Dark Green:** 40.5% (≈15 heads)
* **Bright Green:** 21.6% (≈8 heads)
* **Red:** 2.7% (≈1 head)
* **Dark Red:** 35.1% (≈13 heads)
**Bar 3: Layer Range [16, 24)**
* **Total Height (Approximate):** 25 heads
* **Segment Breakdown (from bottom to top):**
* **Dark Green:** 68.0% (≈17 heads)
* **Bright Green:** 12.0% (≈3 heads)
* **Red:** 0.0% (0 heads)
* **Dark Red:** 20.0% (≈5 heads)
**Bar 4: Layer Range [24, 32)**
* **Total Height (Approximate):** 41 heads
* **Segment Breakdown (from bottom to top):**
* **Dark Green:** 43.9% (≈18 heads)
* **Bright Green:** 31.7% (≈13 heads)
* **Red:** 4.9% (≈2 heads)
* **Dark Red:** 19.5% (≈8 heads)
### Key Observations
1. **Variable Total Heads:** The total number of heads is not constant across layer ranges. The `[16, 24)` range has the fewest (~25), while `[24, 32)` has the most (~41).
2. **Dominant Category Shift:** The **Dark Green** category's proportion generally increases from the first to the third layer range (31.4% → 40.5% → 68.0%), before decreasing in the final range (43.9%).
3. **Inverse Relationship:** There is a clear inverse relationship between the **Dark Green** and **Bright Green** categories. As the share of Dark Green increases (from `[0,8)` to `[16,24)`), the share of Bright Green decreases sharply (48.6% → 21.6% → 12.0%).
4. **Anomaly in [16,24):** The **Red** category is completely absent (0.0%) in the `[16, 24)` layer range.
5. **Dark Red Fluctuation:** The **Dark Red** category shows significant fluctuation, peaking in the `[8, 16)` range at 35.1%.
### Interpretation
This chart visualizes how different types of attention heads (represented by the four colors) are distributed across the layers of the Pythia 6.9B model. The data suggests a functional specialization or reorganization of model components across depth.
* **Early Layers ([0,8)):** Dominated by the **Bright Green** category (nearly half of all heads), suggesting this type of head is crucial for initial processing.
* **Middle Layers ([8,16) & [16,24)):** Show a significant transition. The **Dark Green** category becomes increasingly dominant, while **Bright Green** diminishes. The `[16,24)` range is particularly specialized, with **Dark Green** heads comprising over two-thirds of the total and **Red** heads vanishing entirely. This could indicate a "bottleneck" or a layer range dedicated to a specific, unified computation.
* **Later Layers ([24,32)):** The distribution becomes more balanced again, with a resurgence of **Bright Green** heads and a more even split between **Dark Green** and **Bright Green**. This may reflect a shift towards integrating processed information for final output generation.
The variation in total head count per layer range is also noteworthy, indicating that the model's architecture is not uniform in terms of parallel processing capacity across its depth. The absence of the **Red** category in one specific range is a stark anomaly that would warrant further investigation into the model's design or the metric being measured.