TECHNICAL ASSET FINGERPRINT
5143b5e486b23fd731b04645
Click to view fullscreen
Press ESC or click to close
FOUND IN PAPERS
EXPERT: healer-alpha-free VERSION 1
RUNTIME: free/openrouter/healer-alpha
INTEL_VERIFIED
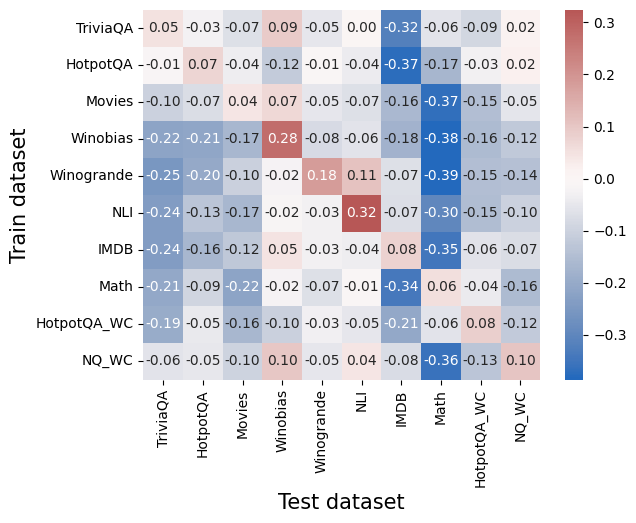
## Heatmap: Cross-Dataset Performance Correlations
### Overview
The image is a heatmap visualization showing the correlation or performance transfer values between various training datasets (y-axis) and test datasets (x-axis). The chart uses a diverging color scale from blue (negative values) to red (positive values) to represent the numerical relationships. Each cell contains a specific numerical value.
### Components/Axes
* **Y-Axis (Vertical):** Labeled "Train dataset". The categories from top to bottom are:
1. TriviaQA
2. HotpotQA
3. Movies
4. Winobias
5. Winogrande
6. NLI
7. IMDB
8. Math
9. HotpotQA_WC
10. NQ_WC
* **X-Axis (Horizontal):** Labeled "Test dataset". The categories from left to right are:
1. TriviaQA
2. HotpotQA
3. Movies
4. Winobias
5. Winogrande
6. NLI
7. IMDB
8. Math
9. HotpotQA_WC
10. NQ_WC
* **Color Bar/Legend:** Positioned on the right side of the chart. It is a vertical gradient bar.
* **Range:** Approximately -0.3 (dark blue) to +0.3 (dark red).
* **Midpoint:** 0.0 is represented by a very light, almost white color.
* **Scale:** The bar has labeled ticks at -0.3, -0.2, -0.1, 0.0, 0.1, 0.2, 0.3.
### Detailed Analysis
The following table reconstructs the heatmap data. Values are read directly from the cells. The color intensity corresponds to the magnitude and sign (red=positive, blue=negative).
| Train \ Test | TriviaQA | HotpotQA | Movies | Winobias | Winogrande | NLI | IMDB | Math | HotpotQA_WC | NQ_WC |
| :--- | :--- | :--- | :--- | :--- | :--- | :--- | :--- | :--- | :--- | :--- |
| **TriviaQA** | 0.05 | -0.03 | -0.07 | 0.09 | -0.05 | 0.00 | **-0.32** | -0.06 | -0.09 | 0.02 |
| **HotpotQA** | -0.01 | 0.07 | -0.04 | -0.12 | -0.01 | -0.04 | **-0.37** | 0.17 | -0.03 | 0.02 |
| **Movies** | -0.10 | -0.07 | 0.04 | 0.07 | -0.05 | -0.07 | -0.16 | **-0.37** | -0.15 | -0.05 |
| **Winobias** | -0.22 | -0.21 | -0.17 | **0.28** | -0.08 | -0.06 | -0.18 | **-0.38** | -0.16 | -0.12 |
| **Winogrande** | -0.25 | -0.20 | -0.10 | -0.02 | **0.18** | 0.11 | -0.07 | **-0.39** | -0.15 | -0.14 |
| **NLI** | -0.24 | -0.13 | -0.17 | -0.02 | -0.03 | **0.32** | -0.07 | -0.30 | -0.15 | -0.10 |
| **IMDB** | -0.24 | -0.16 | -0.12 | 0.05 | -0.03 | -0.04 | **0.08** | **-0.35** | -0.06 | -0.07 |
| **Math** | -0.21 | -0.09 | -0.22 | -0.02 | -0.07 | -0.01 | **-0.34** | 0.06 | -0.04 | -0.16 |
| **HotpotQA_WC** | -0.19 | -0.05 | -0.16 | -0.10 | -0.03 | -0.05 | -0.21 | -0.06 | **0.08** | -0.12 |
| **NQ_WC** | -0.06 | -0.05 | -0.10 | 0.10 | -0.05 | 0.04 | -0.08 | **0.36** | -0.13 | **0.10** |
**Note on Color-Value Cross-Reference:** The strongest positive values (dark red) are 0.32 (NLI train on NLI test), 0.28 (Winobias train on Winobias test), and 0.36 (NQ_WC train on Math test). The strongest negative values (dark blue) are -0.39 (Winogrande train on Math test), -0.38 (Winobias train on Math test), and -0.37 (HotpotQA train on IMDB test).
### Key Observations
1. **Strong Diagonal Positivity:** Most datasets show a positive correlation when the training and testing dataset are the same (the diagonal from top-left to bottom-right). Notable exceptions are `IMDB` (0.08) and `Math` (0.06), which show weak positive self-correlation.
2. **Pervasive Negative Correlation with Math:** The "Math" test column is predominantly dark blue, indicating strong negative values for nearly all training datasets, especially `Winogrande` (-0.39), `Winobias` (-0.38), `TriviaQA` (-0.32), and `IMDB` (-0.35).
3. **Strong Negative Correlation with IMDB:** The "IMDB" test column also shows strong negative values for several training sets, most notably `HotpotQA` (-0.37) and `TriviaQA` (-0.32).
4. **Positive Transfer Anomalies:** There are a few instances of positive correlation between different datasets:
* `NQ_WC` (train) shows a strong positive correlation with `Math` (test) at 0.36.
* `HotpotQA` (train) shows a moderate positive correlation with `Math` (test) at 0.17.
* `NLI` (train) shows a moderate positive correlation with `Winogrande` (test) at 0.11.
5. **Cluster of Negative Values:** The top-left quadrant (e.g., `TriviaQA`, `HotpotQA`, `Movies` training on `TriviaQA`, `HotpotQA`, `Movies` testing) contains many small negative values, suggesting weak negative transfer or interference among these QA and text classification tasks.
### Interpretation
This heatmap likely illustrates **transfer learning performance or interference** between different machine learning datasets. The values could represent differences in model accuracy, loss, or another performance metric when a model trained on one dataset is evaluated on another, compared to a baseline.
* **Diagonal Values:** The generally positive diagonal suggests that models perform best when tested on the same domain they were trained on, which is expected. The weak diagonal for `IMDB` and `Math` might indicate these datasets are either very distinct or that models trained on them generalize poorly even to themselves under the evaluation metric used.
* **Negative Values (Blue):** The widespread negative values, especially for the `Math` and `IMDB` test columns, indicate **negative transfer**. Training on most other datasets hurts performance on these specific test sets. This suggests `Math` and `IMDB` require specialized knowledge or reasoning skills that are not learned, and are perhaps even disrupted, by training on general QA (`TriviaQA`, `HotpotQA`) or other text datasets (`Movies`, `NLI`).
* **Positive Off-Diagonal Values:** The strong positive value for `NQ_WC` → `Math` (0.36) is a critical anomaly. It suggests that the `NQ_WC` (likely "Natural Questions - Wrong Context") dataset contains features or patterns that are highly beneficial for the `Math` task, more so than training on `Math` itself. This could point to a shared underlying reasoning skill (e.g., handling numerical data or multi-step logic) between these seemingly disparate tasks.
* **Overall Pattern:** The chart reveals a complex landscape of task relationships. It shows that most general language tasks interfere with specialized tasks like math reasoning (`Math`) and sentiment/domain classification (`IMDB`). However, it also uncovers a specific, beneficial transfer path (`NQ_WC` to `Math`) that could be exploited for model improvement. The data argues against the notion of a single, universally beneficial pre-training dataset and highlights the importance of task-specific or carefully curated training data.
DECODING INTELLIGENCE...