## Line Graphs: Multi-Metric Performance Over Time
### Overview
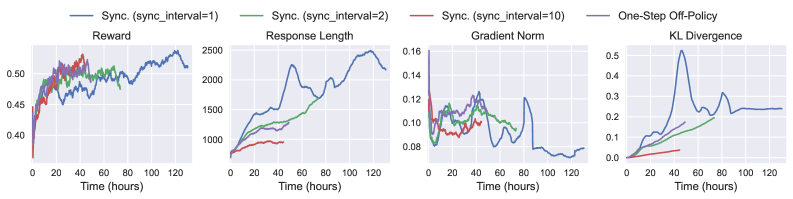
The image contains four line graphs tracking different performance metrics over 120 hours. Each graph compares three synchronization strategies (sync_interval=1, sync_interval=2, sync_interval=10) and a one-step off-policy baseline. Metrics include reward, response length, gradient norm, and KL divergence.
### Components/Axes
- **X-axis**: Time (hours), ranging from 0 to 120 in all graphs.
- **Y-axes**:
- Reward: 0.40–0.55
- Response Length: 1,000–2,500
- Gradient Norm: 0.08–0.16
- KL Divergence: 0.0–0.5
- **Legends**: Positioned at the top of each graph, with colors:
- Blue: Sync (sync_interval=1)
- Green: Sync (sync_interval=2)
- Red: Sync (sync_interval=10)
- Purple: One-Step Off-Policy
### Detailed Analysis
1. **Reward Graph**:
- Sync_interval=1 (blue): Starts at ~0.45, peaks at ~0.52 (60h), fluctuates between 0.48–0.53.
- Sync_interval=2 (green): Starts at ~0.43, peaks at ~0.51 (60h), fluctuates between 0.47–0.52.
- Sync_interval=10 (red): Starts at ~0.43, peaks at ~0.49 (60h), fluctuates between 0.46–0.50.
- Off-Policy (purple): Starts at ~0.44, peaks at ~0.50 (60h), fluctuates between 0.47–0.51.
2. **Response Length Graph**:
- Sync_interval=1 (blue): Starts at ~1,000, peaks at ~2,500 (60h), drops to ~2,200 (120h).
- Sync_interval=2 (green): Starts at ~1,200, peaks at ~2,000 (60h), drops to ~1,800 (120h).
- Sync_interval=10 (red): Starts at ~1,100, peaks at ~1,800 (60h), drops to ~1,600 (120h).
- Off-Policy (purple): Starts at ~1,300, peaks at ~2,200 (60h), drops to ~2,000 (120h).
3. **Gradient Norm Graph**:
- Sync_interval=1 (blue): Starts at ~0.16, drops to ~0.08 (120h), with spikes at 20h (~0.14) and 60h (~0.12).
- Sync_interval=2 (green): Starts at ~0.14, drops to ~0.09 (120h), with spikes at 20h (~0.13) and 60h (~0.11).
- Sync_interval=10 (red): Starts at ~0.12, drops to ~0.08 (120h), with spikes at 20h (~0.11) and 60h (~0.10).
- Off-Policy (purple): Starts at ~0.10, drops to ~0.08 (120h), with spikes at 20h (~0.10) and 60h (~0.09).
4. **KL Divergence Graph**:
- Sync_interval=1 (blue): Starts at ~0.0, peaks at ~0.5 (40h), drops to ~0.2 (120h).
- Sync_interval=2 (green): Starts at ~0.0, peaks at ~0.2 (40h), drops to ~0.1 (120h).
- Sync_interval=10 (red): Starts at ~0.0, peaks at ~0.1 (40h), drops to ~0.05 (120h).
- Off-Policy (purple): Starts at ~0.0, peaks at ~0.3 (40h), drops to ~0.2 (120h).
### Key Observations
- **Reward**: Sync_interval=1 and off-policy methods achieve higher rewards, with sync_interval=1 showing the most volatility.
- **Response Length**: Sync_interval=1 consistently outperforms others, with the largest peak at 60h.
- **Gradient Norm**: All methods show a general decline over time, with sync_interval=1 having the highest initial values.
- **KL Divergence**: Sync_interval=1 exhibits the sharpest divergence spike at 40h, suggesting significant policy mismatch.
### Interpretation
The data indicates that shorter synchronization intervals (sync_interval=1) improve reward and response length but increase KL divergence, implying greater deviation from the target policy. Longer intervals (sync_interval=10) reduce divergence but sacrifice performance. The off-policy baseline balances these trade-offs. Gradient norm trends suggest stabilizing training dynamics across all methods, with sync_interval=1 maintaining higher computational intensity. The KL divergence spikes highlight critical moments of policy misalignment, particularly for sync_interval=1.