\n
## Scatter Plot: Confidence vs. Target Length (Professional Psychology)
### Overview
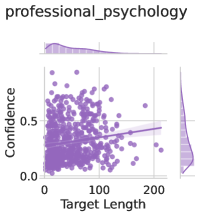
The image presents a scatter plot visualizing the relationship between "Target Length" and "Confidence" for the category "professional_psychology". A regression line with a shaded confidence interval is overlaid on the scatter points. The plot suggests a very weak, potentially positive correlation between target length and confidence.
### Components/Axes
* **Title:** "professional\_psychology" (top-center)
* **X-axis:** "Target Length" (bottom-center), ranging from approximately 0 to 220.
* **Y-axis:** "Confidence" (left-center), ranging from approximately 0.0 to 0.6.
* **Data Points:** Purple circles representing individual data points.
* **Regression Line:** A dark purple line representing the trend of the data.
* **Confidence Interval:** A light purple shaded area around the regression line, indicating the uncertainty in the estimated trend.
* **Marginal Distributions:** Histograms at the top and right edges of the plot, showing the distribution of "Target Length" and "Confidence" respectively.
### Detailed Analysis
The scatter plot shows a dense cluster of points concentrated in the lower-left quadrant, with a gradual spread towards the upper-right.
* **Regression Line Trend:** The regression line has a very slight positive slope, indicating a weak positive correlation.
* **Data Point Distribution:** The majority of data points have a "Target Length" between 0 and 100, and a "Confidence" value between 0.2 and 0.5.
* **Marginal Distribution - Target Length:** The histogram at the top shows a distribution skewed to the right, with a peak around a "Target Length" of approximately 20-40. There is a long tail extending to higher values.
* **Marginal Distribution - Confidence:** The histogram on the right shows a distribution concentrated at lower confidence values, with a peak around 0.3. The distribution tapers off towards higher confidence values.
* **Data Points (Approximate Values):**
* At Target Length = 0, Confidence ranges from approximately 0.1 to 0.5.
* At Target Length = 50, Confidence ranges from approximately 0.2 to 0.55.
* At Target Length = 100, Confidence ranges from approximately 0.1 to 0.5.
* At Target Length = 200, Confidence ranges from approximately 0.05 to 0.3.
### Key Observations
* The relationship between "Target Length" and "Confidence" appears to be very weak. The regression line has a minimal slope.
* There is a high density of data points with low "Confidence" values.
* The marginal distributions reveal that "Target Length" is skewed to the right, while "Confidence" is concentrated at lower values.
* There are a few outliers with higher "Target Length" values and relatively low "Confidence" values.
### Interpretation
The data suggests that, for the category "professional\_psychology", there is little to no strong relationship between the length of the target and the confidence associated with it. The slight positive trend observed in the regression line is likely not statistically significant given the spread of the data. The concentration of points at lower confidence levels suggests that, in general, there is a relatively low level of confidence associated with targets in this domain. The skewed distribution of "Target Length" indicates that most targets are relatively short, with a few exceptionally long ones. The marginal distributions provide additional context, showing the overall distribution of each variable independently. The lack of a clear pattern in the scatter plot suggests that other factors likely play a more significant role in determining confidence levels than simply the length of the target.