\n
## Line Chart: Pass@k vs. Number of Sample k
### Overview
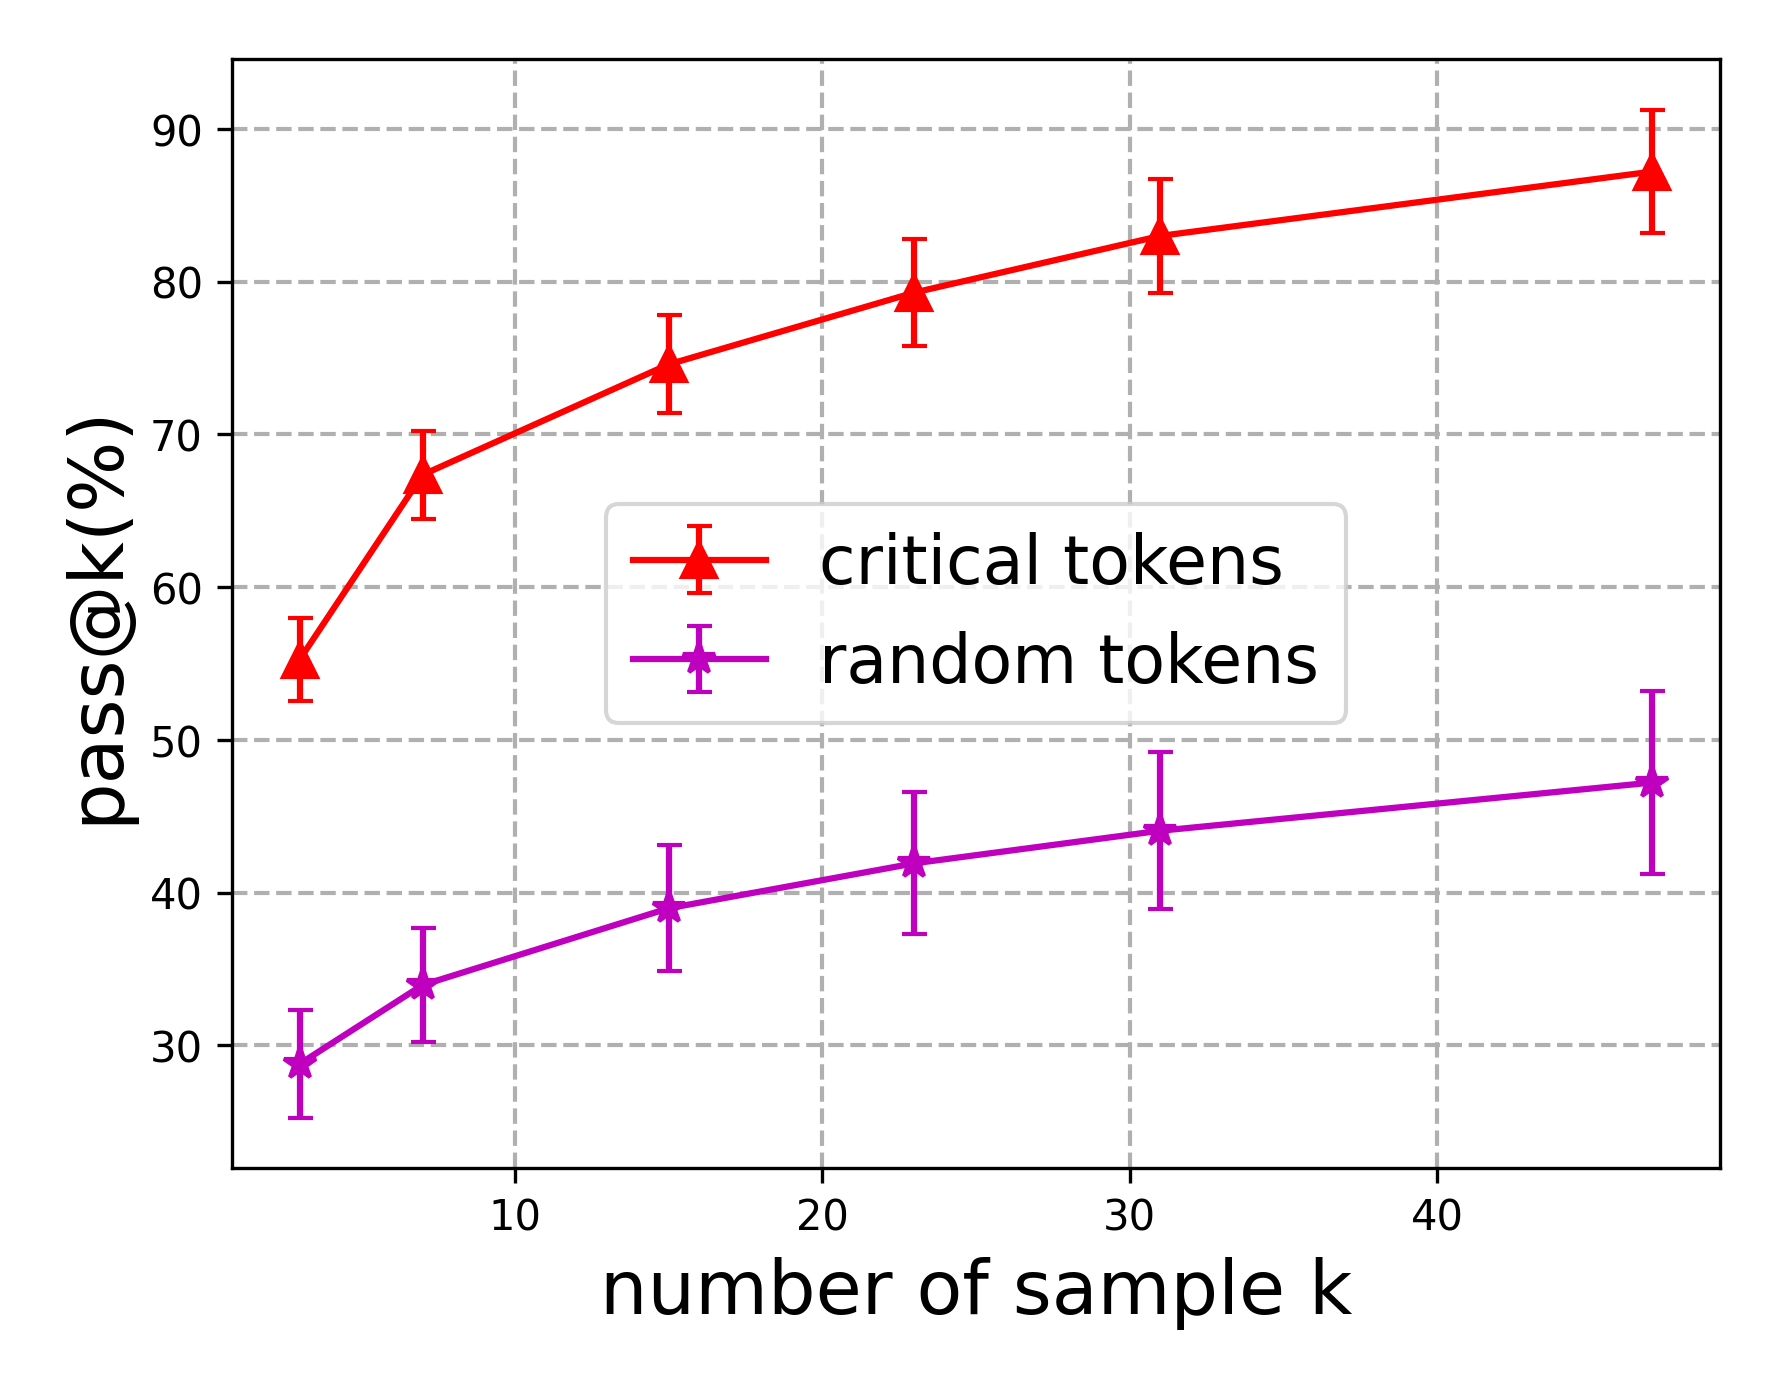
This line chart compares the performance of "critical tokens" and "random tokens" based on the metric "pass@k (%)" as a function of the "number of sample k". The chart displays two lines with error bars, representing the mean and standard deviation of the pass@k metric for each token type at different values of k.
### Components/Axes
* **X-axis:** "number of sample k". Scale ranges from approximately 0 to 45, with markers at 0, 10, 20, 30, and 40.
* **Y-axis:** "pass@k (%)". Scale ranges from approximately 25% to 95%, with markers at 30%, 40%, 50%, 60%, 70%, 80%, and 90%.
* **Legend:** Located in the top-right corner.
* Red line with error bars: "critical tokens"
* Purple line with error bars: "random tokens"
* **Gridlines:** Horizontal and vertical gridlines are present to aid in reading values.
### Detailed Analysis
**Critical Tokens (Red Line):**
The red line representing "critical tokens" shows an upward trend.
* At k = 0, pass@k is approximately 54% ± 6%.
* At k = 10, pass@k is approximately 68% ± 5%.
* At k = 20, pass@k is approximately 77% ± 4%.
* At k = 30, pass@k is approximately 81% ± 4%.
* At k = 40, pass@k is approximately 86% ± 4%.
**Random Tokens (Purple Line):**
The purple line representing "random tokens" also shows an upward trend, but is less steep than the red line.
* At k = 0, pass@k is approximately 28% ± 4%.
* At k = 10, pass@k is approximately 34% ± 4%.
* At k = 20, pass@k is approximately 41% ± 4%.
* At k = 30, pass@k is approximately 44% ± 4%.
* At k = 40, pass@k is approximately 48% ± 6%.
The error bars indicate the variability in the pass@k metric for each token type at each value of k. The error bars are relatively consistent in size across the range of k values.
### Key Observations
* "Critical tokens" consistently outperform "random tokens" across all values of k.
* The performance gap between "critical tokens" and "random tokens" widens as k increases.
* The rate of improvement in pass@k decreases as k increases for both token types.
* The error bars suggest that the variability in performance is relatively consistent across different values of k.
### Interpretation
The data suggests that selecting "critical tokens" leads to significantly better performance (as measured by pass@k) compared to selecting "random tokens". This indicates that the "critical tokens" are more informative or relevant for the task being evaluated. As the number of samples (k) increases, the performance of both token types improves, but the advantage of using "critical tokens" becomes more pronounced. This could be because the "critical tokens" provide a stronger signal, allowing for more accurate predictions even with a limited number of samples. The consistent error bars suggest that the observed differences in performance are statistically significant and not due to random chance. The diminishing returns in performance as k increases suggest that there may be a point of diminishing returns where adding more samples does not significantly improve the pass@k metric. This could be due to the fact that the most informative tokens have already been selected, and adding more samples provides less additional information.