## Line Graph: Pass@k Performance Comparison
### Overview
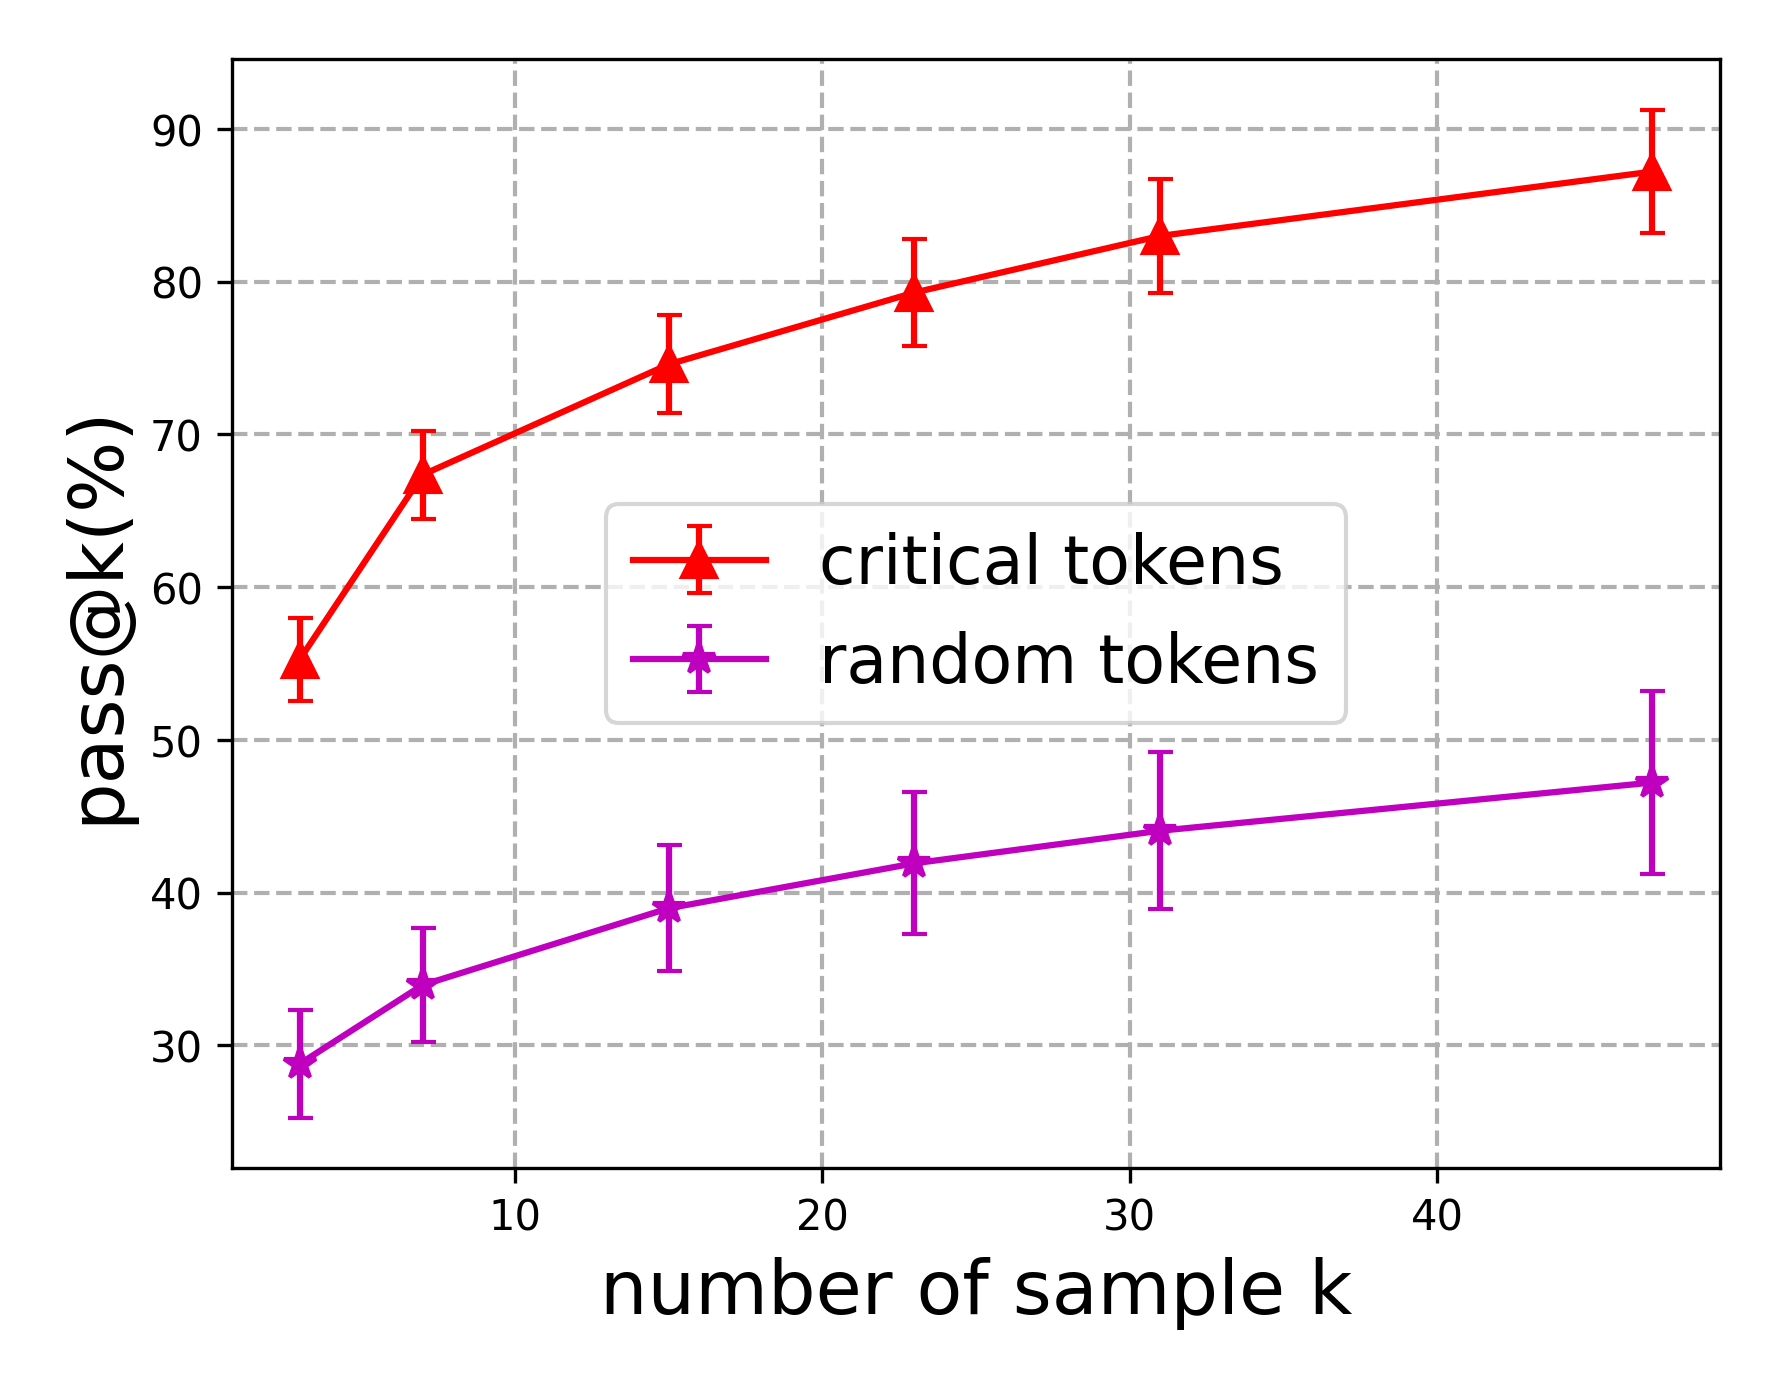
The image displays a line graph comparing the performance of two token selection strategies ("critical tokens" and "random tokens") across varying sample sizes (k). The y-axis represents "pass@k (%)" (percentage of successful outcomes), while the x-axis represents "number of sample k" (sample size). Two data series are plotted with distinct markers and error bars, showing performance trends as sample size increases.
### Components/Axes
- **X-axis**: "number of sample k" (ranges from 5 to 45 in increments of 10)
- **Y-axis**: "pass@k (%)" (ranges from 30% to 90% in increments of 10)
- **Legend**: Located in the top-right corner, with:
- Red triangles (▲) labeled "critical tokens"
- Purple stars (★) labeled "random tokens"
- **Error Bars**: Vertical lines extending from each data point, indicating measurement uncertainty.
### Detailed Analysis
#### Critical Tokens (Red)
- **Trend**: Steep upward trajectory from ~55% at k=5 to ~85% at k=45.
- **Data Points**:
- k=5: 55% ±3%
- k=15: 75% ±2%
- k=25: 80% ±2%
- k=35: 82% ±1%
- k=45: 85% ±2%
- **Error Bars**: Consistently ±1–3%, smallest at k=35.
#### Random Tokens (Purple)
- **Trend**: Gradual upward slope from ~30% at k=5 to ~47% at k=45.
- **Data Points**:
- k=5: 30% ±3%
- k=15: 38% ±2%
- k=25: 42% ±3%
- k=35: 44% ±2%
- k=45: 47% ±3%
- **Error Bars**: Larger variability (±2–3%) compared to critical tokens.
### Key Observations
1. **Performance Gap**: Critical tokens consistently outperform random tokens across all sample sizes (e.g., 55% vs. 30% at k=5; 85% vs. 47% at k=45).
2. **Error Margin**: Critical tokens exhibit tighter error bars, suggesting more reliable measurements.
3. **Diminishing Returns**: Both strategies show slowing growth in pass@k as k increases, but critical tokens maintain a higher plateau.
### Interpretation
The data demonstrates that critical token selection significantly improves performance reliability compared to random selection. The steeper slope and smaller error margins for critical tokens suggest they are more effective at capturing relevant information in larger datasets. The diminishing returns for both strategies imply that increasing sample size beyond a certain point yields diminishing benefits, but critical tokens retain a clear advantage. This could reflect their ability to prioritize high-impact tokens in applications like NLP or recommendation systems.