## Line Chart: HellaSwag Benchmark Scores by Model Number
### Overview
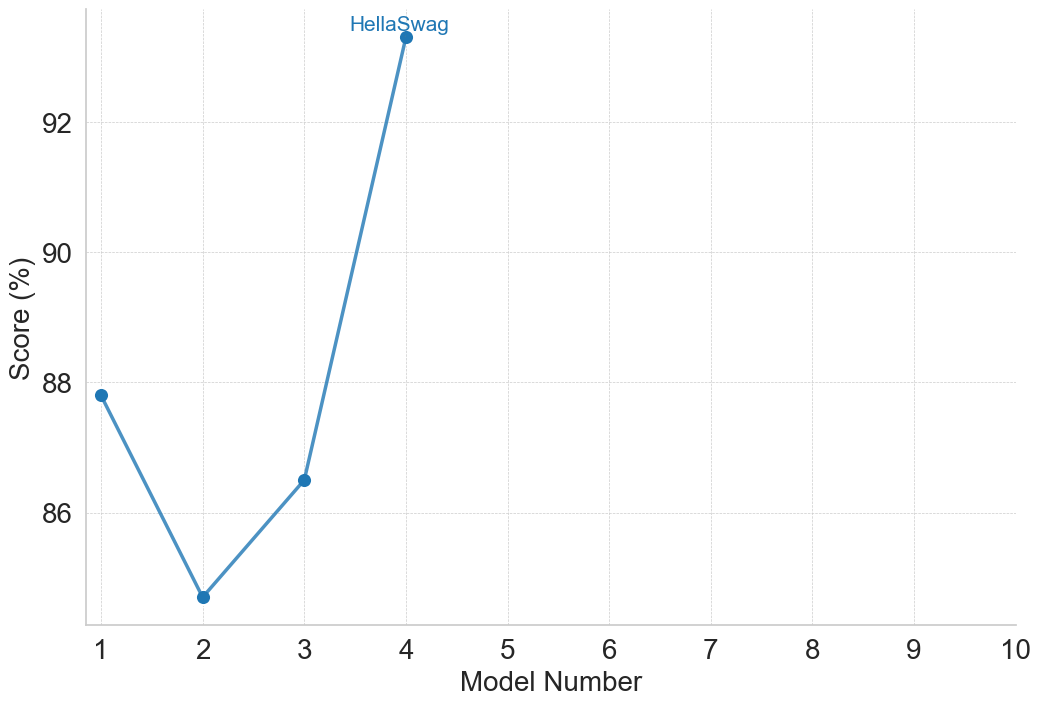
The image displays a line chart plotting performance scores (in percentage) against a sequence of model numbers. The chart is titled "HellaSwag," which is a known benchmark for evaluating commonsense reasoning in AI models. The data shows a non-linear trend across four models, with a significant performance spike at the fourth model.
### Components/Axes
* **Chart Title:** "HellaSwag" (centered at the top of the chart area).
* **Y-Axis (Vertical):**
* **Label:** "Score (%)" (rotated vertically on the left side).
* **Scale:** Linear scale ranging from 86 to 92, with major tick marks and grid lines at 86, 88, 90, and 92. The axis extends slightly below 86 and above 92.
* **X-Axis (Horizontal):**
* **Label:** "Model Number" (centered at the bottom).
* **Scale:** Discrete integer scale from 1 to 10, with major tick marks and labels for each integer. Data is only present for models 1 through 4.
* **Data Series:** A single data series represented by a solid blue line connecting circular blue data points. There is no separate legend box; the title "HellaSwag" serves as the identifier for the plotted series.
* **Grid:** A light gray, dotted grid is present for both major x and y ticks.
### Detailed Analysis
The chart plots the HellaSwag benchmark score for four distinct models. The approximate values, read from the chart, are as follows:
* **Model 1:** Score ≈ 87.8% (The point is slightly below the 88% grid line).
* **Model 2:** Score ≈ 84.8% (The point is significantly below the 86% grid line, representing the lowest score in the series).
* **Model 3:** Score ≈ 86.5% (The point is above the 86% grid line but below the midpoint to 88%).
* **Model 4:** Score ≈ 93.5% (The point is above the 92% grid line, representing the highest score and a dramatic increase from the previous model).
**Trend Verification:**
1. From Model 1 to Model 2: The line slopes sharply downward.
2. From Model 2 to Model 3: The line slopes upward.
3. From Model 3 to Model 4: The line slopes very steeply upward, indicating a major performance improvement.
### Key Observations
1. **Non-Linear Progression:** Performance does not improve steadily with model number. There is a notable dip at Model 2.
2. **Significant Outlier:** Model 4's performance is a clear outlier, scoring approximately 7 percentage points higher than the next best model (Model 1) and nearly 9 points higher than the lowest (Model 2).
3. **Data Range:** The x-axis extends to Model 10, but data is only provided for the first four models, leaving the performance of models 5-10 unknown.
4. **Visual Emphasis:** The steep final segment of the line visually emphasizes the breakthrough performance of Model 4.
### Interpretation
This chart likely illustrates the progression of different versions or iterations of an AI model on the HellaSwag commonsense reasoning benchmark. The data suggests that development was not linear; an earlier iteration (Model 2) underperformed its predecessor (Model 1). However, a subsequent iteration (Model 4) achieved a substantial leap in capability.
The dramatic improvement at Model 4 could indicate a fundamental architectural change, a significant increase in training data or compute, or the incorporation of a new training technique. The chart effectively communicates that the latest model in this sequence represents a major step forward on this specific benchmark. The empty space for models 5-10 implies this is either a work in progress or that only select models were chosen for this comparison. The absence of a traditional legend, using the chart title instead, is a concise design choice suitable for a single-series plot.