## Chart Type: Scatter Plot and Line Graph
### Overview
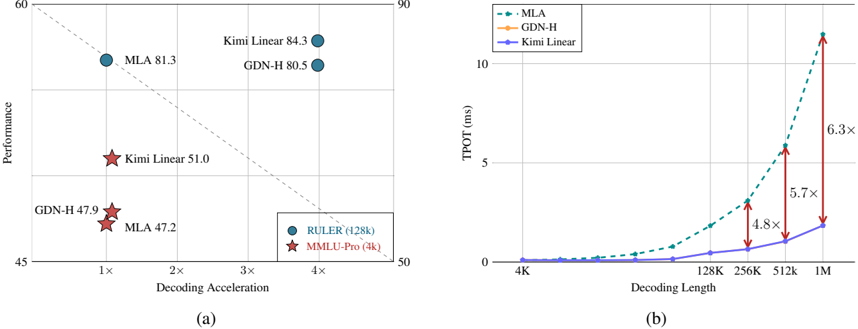
The image presents two charts comparing the performance and efficiency of different models (MLA, GDN-H, Kimi Linear) in terms of decoding acceleration, performance, and decoding length. Chart (a) is a scatter plot showing performance vs. decoding acceleration, while chart (b) is a line graph showing TPOT (ms) vs. decoding length.
### Components/Axes
**Chart (a): Scatter Plot**
* **X-axis:** Decoding Acceleration (labeled as "Decoding Acceleration") with markers at 1x, 2x, 3x, and 4x.
* **Y-axis:** Performance (labeled as "Performance") with markers at 45, 50, 60, and 90.
* **Data Points:**
* RULER (128k) - Represented by blue circles.
* MMLU-Pro (4k) - Represented by red stars.
* **Legend:** Located at the bottom-right of the chart.
* **Models:** MLA, GDN-H, Kimi Linear.
**Chart (b): Line Graph**
* **X-axis:** Decoding Length (labeled as "Decoding Length") with markers at 4K, 128K, 256K, 512K, and 1M.
* **Y-axis:** TPOT (ms) (labeled as "TPOT (ms)") with markers at 0, 5, and 10.
* **Data Series:**
* MLA - Represented by a dashed green line with square markers.
* GDN-H - Represented by a solid orange line with circular markers.
* Kimi Linear - Represented by a solid blue line with circular markers.
* **Legend:** Located at the top-left of the chart.
* **Vertical Arrows:** Red arrows indicating the multiplication factor between the Kimi Linear and MLA lines at 256K, 512K, and 1M decoding lengths.
### Detailed Analysis
**Chart (a): Scatter Plot**
* **RULER (128k) - MLA:**
* Decoding Acceleration: Approximately 1x, Performance: Approximately 47.2
* Decoding Acceleration: Approximately 4x, Performance: Approximately 81.3
* **RULER (128k) - GDN-H:**
* Decoding Acceleration: Approximately 4x, Performance: Approximately 80.5
* **RULER (128k) - Kimi Linear:**
* Decoding Acceleration: Approximately 4x, Performance: Approximately 84.3
* **MMLU-Pro (4k) - Kimi Linear:**
* Decoding Acceleration: Approximately 1x, Performance: Approximately 51.0
* **MMLU-Pro (4k) - GDN-H:**
* Decoding Acceleration: Approximately 1x, Performance: Approximately 47.9
**Chart (b): Line Graph**
* **MLA (Dashed Green Line):** The TPOT increases exponentially with decoding length.
* 4K: Approximately 0.1 ms
* 128K: Approximately 0.3 ms
* 256K: Approximately 1.0 ms
* 512K: Approximately 2.5 ms
* 1M: Approximately 8.0 ms
* **GDN-H (Solid Orange Line):** The TPOT increases exponentially with decoding length.
* 4K: Approximately 0.1 ms
* 128K: Approximately 0.3 ms
* 256K: Approximately 0.8 ms
* 512K: Approximately 2.0 ms
* 1M: Approximately 6.0 ms
* **Kimi Linear (Solid Blue Line):** The TPOT increases slowly with decoding length.
* 4K: Approximately 0.1 ms
* 128K: Approximately 0.1 ms
* 256K: Approximately 0.2 ms
* 512K: Approximately 0.4 ms
* 1M: Approximately 1.3 ms
* **Multiplication Factors (Red Arrows):**
* 256K: MLA is approximately 4.8x higher than Kimi Linear.
* 512K: MLA is approximately 5.7x higher than Kimi Linear.
* 1M: MLA is approximately 6.3x higher than Kimi Linear.
### Key Observations
* In Chart (a), Kimi Linear achieves the highest performance at 4x decoding acceleration, while MMLU-Pro (4k) models have lower performance at 1x decoding acceleration.
* In Chart (b), TPOT increases significantly with decoding length for MLA and GDN-H, while Kimi Linear shows a much slower increase.
* The multiplication factors in Chart (b) indicate that the difference in TPOT between MLA and Kimi Linear increases as the decoding length increases.
### Interpretation
The charts compare the performance and efficiency of different models. Chart (a) shows that Kimi Linear achieves the highest performance with RULER (128k), while MMLU-Pro (4k) models have lower performance. Chart (b) demonstrates that MLA and GDN-H have a much higher TPOT (time per output token) as the decoding length increases compared to Kimi Linear. This suggests that Kimi Linear is more efficient in terms of processing time for longer sequences. The increasing multiplication factors highlight that the efficiency gap between MLA and Kimi Linear widens as the decoding length grows. The data suggests a trade-off between performance and efficiency, where Kimi Linear prioritizes efficiency (lower TPOT) while still achieving competitive performance.