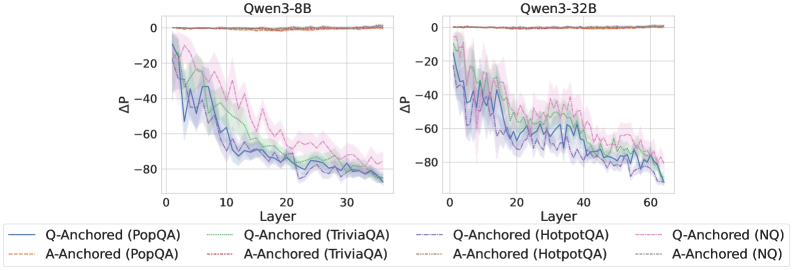
## Line Chart: Delta P vs Layer for Qwen3-8B and Qwen3-32B
### Overview
The image contains two line charts comparing the performance of Qwen3-8B and Qwen3-32B models across different layers. The charts plot the change in performance (Delta P) against the layer number for various question-answering tasks, using both question-anchored (Q-Anchored) and answer-anchored (A-Anchored) approaches. The shaded regions around the lines indicate the uncertainty or variability in the performance.
### Components/Axes
* **Titles:**
* Left Chart: "Qwen3-8B"
* Right Chart: "Qwen3-32B"
* **X-axis (Layer):**
* Left Chart: Ranges from 0 to 30, with tick marks at intervals of 10.
* Right Chart: Ranges from 0 to 60, with tick marks at intervals of 20.
* Label: "Layer"
* **Y-axis (ΔP):**
* Both Charts: Ranges from -80 to 0, with tick marks at intervals of 20.
* Label: "ΔP"
* **Legend (bottom):**
* Q-Anchored (PopQA): Solid Blue Line
* A-Anchored (PopQA): Dashed Brown Line
* Q-Anchored (TriviaQA): Dotted Green Line
* A-Anchored (TriviaQA): Dash-Dotted Green Line
* Q-Anchored (HotpotQA): Dash-Dot Blue Line
* A-Anchored (HotpotQA): Dotted Blue Line
* Q-Anchored (NQ): Dash-Dotted Pink Line
* A-Anchored (NQ): Dotted Pink Line
### Detailed Analysis
**Left Chart (Qwen3-8B):**
* **Q-Anchored (PopQA):** (Solid Blue) Starts at approximately -15 at layer 0 and decreases to approximately -80 by layer 30.
* **A-Anchored (PopQA):** (Dashed Brown) Remains relatively constant around 0 across all layers.
* **Q-Anchored (TriviaQA):** (Dotted Green) Starts at approximately -20 at layer 0 and decreases to approximately -75 by layer 30.
* **A-Anchored (TriviaQA):** (Dash-Dotted Green) Starts at approximately -20 at layer 0 and decreases to approximately -75 by layer 30.
* **Q-Anchored (HotpotQA):** (Dash-Dot Blue) Starts at approximately -15 at layer 0 and decreases to approximately -80 by layer 30.
* **A-Anchored (HotpotQA):** (Dotted Blue) Starts at approximately -15 at layer 0 and decreases to approximately -80 by layer 30.
* **Q-Anchored (NQ):** (Dash-Dotted Pink) Starts at approximately -20 at layer 0 and decreases to approximately -70 by layer 30.
* **A-Anchored (NQ):** (Dotted Pink) Starts at approximately -20 at layer 0 and decreases to approximately -70 by layer 30.
**Right Chart (Qwen3-32B):**
* **Q-Anchored (PopQA):** (Solid Blue) Starts at approximately -20 at layer 0 and decreases to approximately -90 by layer 60.
* **A-Anchored (PopQA):** (Dashed Brown) Remains relatively constant around 0 across all layers.
* **Q-Anchored (TriviaQA):** (Dotted Green) Starts at approximately -20 at layer 0 and decreases to approximately -80 by layer 60.
* **A-Anchored (TriviaQA):** (Dash-Dotted Green) Starts at approximately -20 at layer 0 and decreases to approximately -80 by layer 60.
* **Q-Anchored (HotpotQA):** (Dash-Dot Blue) Starts at approximately -20 at layer 0 and decreases to approximately -90 by layer 60.
* **A-Anchored (HotpotQA):** (Dotted Blue) Starts at approximately -20 at layer 0 and decreases to approximately -90 by layer 60.
* **Q-Anchored (NQ):** (Dash-Dotted Pink) Starts at approximately -20 at layer 0 and decreases to approximately -70 by layer 60.
* **A-Anchored (NQ):** (Dotted Pink) Starts at approximately -20 at layer 0 and decreases to approximately -70 by layer 60.
### Key Observations
* For both models, the A-Anchored (PopQA) performance remains relatively constant near 0 across all layers.
* The Q-Anchored and A-Anchored lines for TriviaQA, HotpotQA, and NQ datasets show a decreasing trend as the layer number increases.
* The Qwen3-32B model generally shows a steeper decline in Delta P compared to the Qwen3-8B model for Q-Anchored datasets.
* The shaded regions indicate variability in performance, which appears to be more pronounced in the Qwen3-32B model.
### Interpretation
The charts suggest that the performance of the Qwen3 models, particularly when anchored to the question, decreases as the layer number increases for TriviaQA, HotpotQA, and NQ datasets. This could indicate that deeper layers are not effectively contributing to the question-answering task for these datasets, or that the model is overfitting to the training data in later layers. The A-Anchored (PopQA) performance remaining constant suggests that anchoring to the answer provides a stable baseline. The Qwen3-32B model, being larger, shows a more pronounced decline, potentially indicating a greater susceptibility to overfitting or a need for more regularization. The variability in performance, as indicated by the shaded regions, highlights the importance of considering the uncertainty in these measurements.