TECHNICAL ASSET FINGERPRINT
5230a39ce927333e1531d6fe
Click to view fullscreen
Press ESC or click to close
FOUND IN PAPERS
EXPERT: gemini-2.5-flash-free VERSION 1
RUNTIME: google-free/gemini-2.5-flash
INTEL_VERIFIED
## Chart Type: Line Chart: Mean Pass Rate vs. Mean Number of Tokens Generated for Different GPT Models and Repair Strategies
### Overview
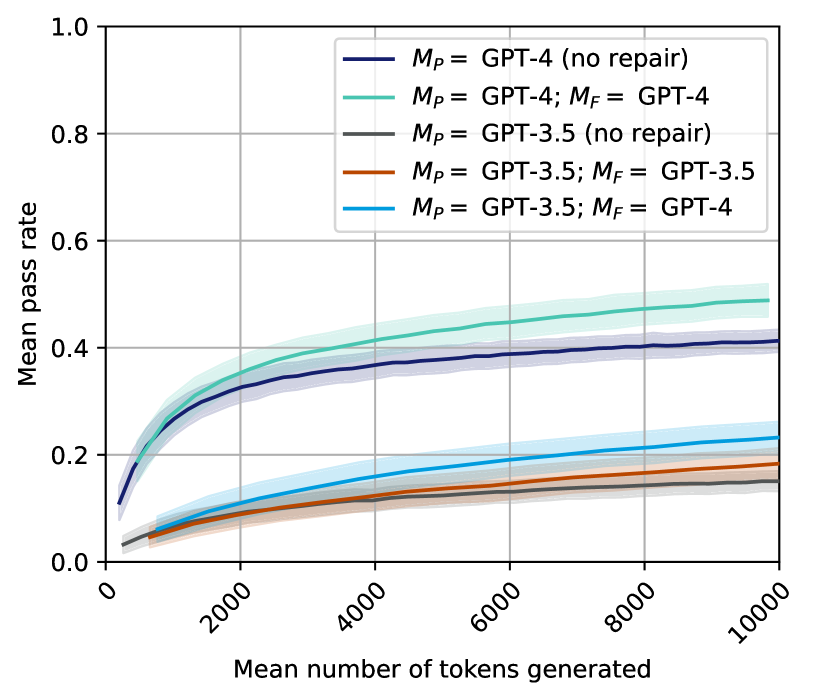
This line chart illustrates the relationship between the "Mean pass rate" and the "Mean number of tokens generated" for five distinct configurations of GPT models (GPT-4 and GPT-3.5), with and without repair mechanisms. Each colored line represents a specific model configuration, and a shaded area surrounding each line indicates the associated uncertainty or confidence interval. The chart allows for a comparative analysis of model performance under varying conditions.
### Components/Axes
* **X-axis Title**: "Mean number of tokens generated"
* **X-axis Range**: From 0 to 10000.
* **X-axis Major Tick Markers**: 0, 2000, 4000, 6000, 8000, 10000. The numerical labels are rotated counter-clockwise.
* **Y-axis Title**: "Mean pass rate"
* **Y-axis Range**: From 0.0 to 1.0.
* **Y-axis Major Tick Markers**: 0.0, 0.2, 0.4, 0.6, 0.8, 1.0.
* **Legend**: Located in the top-right quadrant of the plot area.
* **Dark Blue Line**: $M_P$ = GPT-4 (no repair)
* **Teal/Light Green Line**: $M_P$ = GPT-4; $M_F$ = GPT-4
* **Dark Gray Line**: $M_P$ = GPT-3.5 (no repair)
* **Brown/Orange Line**: $M_P$ = GPT-3.5; $M_F$ = GPT-3.5
* **Light Blue Line**: $M_P$ = GPT-3.5; $M_F$ = GPT-4
### Detailed Analysis
All data series generally exhibit an initial rapid increase in mean pass rate as the mean number of tokens generated increases, followed by a gradual flattening, suggesting diminishing returns. Each line is accompanied by a shaded region representing its uncertainty, which tends to widen with higher token counts.
1. **Teal/Light Green Line**: $M_P$ = GPT-4; $M_F$ = GPT-4
* **Trend**: This line shows the highest performance. It starts near 0.0, rises steeply, and then continues to increase at a slower rate, consistently staying above all other lines.
* **Approximate Data Points**:
* At X=0: Y is approximately 0.0.
* At X=2000: Y is approximately 0.35.
* At X=4000: Y is approximately 0.42.
* At X=6000: Y is approximately 0.45.
* At X=8000: Y is approximately 0.47.
* At X=10000: Y is approximately 0.49.
* **Uncertainty**: The shaded area is relatively wide, particularly at higher token counts, indicating a notable range of possible pass rates.
2. **Dark Blue Line**: $M_P$ = GPT-4 (no repair)
* **Trend**: This line starts around 0.1, rises sharply, and then continues to increase, but at a lower rate than the teal line. It consistently holds the second-highest performance.
* **Approximate Data Points**:
* At X=0: Y is approximately 0.1.
* At X=2000: Y is approximately 0.3.
* At X=4000: Y is approximately 0.35.
* At X=6000: Y is approximately 0.37.
* At X=8000: Y is approximately 0.39.
* At X=10000: Y is approximately 0.41.
* **Uncertainty**: The shaded area is visible and comparable in width to the teal line, suggesting similar variability.
3. **Light Blue Line**: $M_P$ = GPT-3.5; $M_F$ = GPT-4
* **Trend**: This line starts very low, rises steadily, and then flattens out. It performs significantly better than the other GPT-3.5 configurations but remains below the GPT-4 configurations.
* **Approximate Data Points**:
* At X=0: Y is approximately 0.02.
* At X=2000: Y is approximately 0.1.
* At X=4000: Y is approximately 0.15.
* At X=6000: Y is approximately 0.18.
* At X=8000: Y is approximately 0.21.
* At X=10000: Y is approximately 0.23.
* **Uncertainty**: The shaded area is present and appears to be of moderate width.
4. **Brown/Orange Line**: $M_P$ = GPT-3.5; $M_F$ = GPT-3.5
* **Trend**: This line starts very low, rises gradually, and then flattens out. It performs slightly better than the dark gray line but considerably worse than the light blue line.
* **Approximate Data Points**:
* At X=0: Y is approximately 0.02.
* At X=2000: Y is approximately 0.07.
* At X=4000: Y is approximately 0.1.
* At X=6000: Y is approximately 0.12.
* At X=8000: Y is approximately 0.14.
* At X=10000: Y is approximately 0.16.
* **Uncertainty**: The shaded area is visible and appears to be of moderate width.
5. **Dark Gray Line**: $M_P$ = GPT-3.5 (no repair)
* **Trend**: This line starts very low, rises gradually, and then flattens out. It consistently shows the lowest performance across the entire range.
* **Approximate Data Points**:
* At X=0: Y is approximately 0.02.
* At X=2000: Y is approximately 0.05.
* At X=4000: Y is approximately 0.08.
* At X=6000: Y is approximately 0.1.
* At X=8000: Y is approximately 0.12.
* At X=10000: Y is approximately 0.14.
* **Uncertainty**: The shaded area is present and appears to be of moderate width, similar to the brown line.
### Key Observations
* **GPT-4 Dominance**: Configurations using GPT-4 as the primary model ($M_P$) consistently achieve significantly higher mean pass rates compared to those using GPT-3.5 as the primary model.
* **Repair Mechanism Effectiveness**:
* For GPT-4, employing GPT-4 for repair ($M_F$ = GPT-4) results in the highest pass rate, outperforming GPT-4 with no repair.
* For GPT-3.5, using GPT-3.5 for repair ($M_F$ = GPT-3.5) provides a marginal improvement over GPT-3.5 with no repair.
* **Cross-Model Repair Impact**: The most substantial improvement for a GPT-3.5 primary model is observed when GPT-4 is used for repair ($M_P$ = GPT-3.5; $M_F$ = GPT-4). This configuration achieves a pass rate roughly double that of GPT-3.5 with no repair or GPT-3.5 with GPT-3.5 repair, and approaches the performance of GPT-4 with no repair.
* **Performance Ceiling**: All models show a rapid increase in pass rate at lower token counts (up to ~4000 tokens), after which the rate of improvement diminishes, suggesting a plateau in performance gains beyond a certain number of generated tokens.
* **Uncertainty Growth**: The confidence intervals (shaded areas) generally widen as the number of tokens generated increases, indicating greater variability in pass rates at higher token counts.
### Interpretation
This chart provides compelling evidence regarding the capabilities of different large language models (GPT-4 vs. GPT-3.5) and the strategic benefits of incorporating a "repair" mechanism, particularly when leveraging a more powerful model for repair.
1. **Inherent Model Strength**: GPT-4 demonstrates superior inherent capability in achieving higher pass rates, even without any explicit repair process. This suggests that GPT-4's initial generations are of higher quality or more robust.
2. **Synergy of Generation and Repair**: The best performance is achieved when GPT-4 is used for both primary generation ($M_P$) and repair ($M_F$). This indicates that even highly capable models can benefit from an iterative refinement process, where the same strong model can identify and correct its own potential flaws.
3. **Upskilling with Repair**: A key finding is the significant performance boost for GPT-3.5 when paired with GPT-4 for repair. This "cross-model repair" strategy allows a less capable primary generator (GPT-3.5) to achieve pass rates comparable to, or even exceeding, a stronger model (GPT-4) operating without repair. This implies that a powerful repair model can effectively compensate for the limitations of a weaker generation model, making it a valuable strategy for improving output quality without solely relying on the most advanced primary generator.
4. **Efficiency Considerations**: The flattening of the curves suggests that there is an optimal range for the number of tokens generated. Beyond approximately 6000-8000 tokens, the marginal gains in pass rate become minimal. This has practical implications for resource allocation, as generating an excessive number of tokens might not yield proportional improvements in pass rate, leading to inefficient computation.
5. **Strategic Model Deployment**: The data suggests a tiered approach to model deployment. For maximum performance, GPT-4 with GPT-4 repair is ideal. If cost or latency constraints limit the use of GPT-4 for primary generation, a hybrid approach of GPT-3.5 for generation and GPT-4 for repair offers a highly effective alternative, significantly outperforming GPT-3.5 alone. This strategy allows for a balance between performance and resource utilization.
DECODING INTELLIGENCE...