## Line Chart: Model Performance Comparison
### Overview
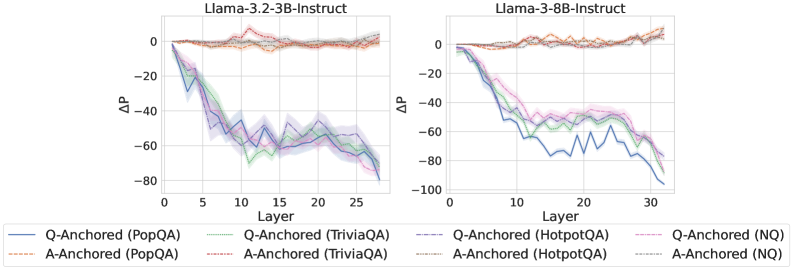
The image presents two line charts comparing the performance of different language models (Llama-3.2-3B-Instruct and Llama-3-8B-Instruct) across various layers. The charts depict the change in performance (ΔP) as a function of the layer number for different question-answering tasks.
### Components/Axes
* **Titles:**
* Left Chart: Llama-3.2-3B-Instruct
* Right Chart: Llama-3-8B-Instruct
* **X-axis (Layer):** Represents the layer number of the model.
* Left Chart: Scale from 0 to 25, incrementing by 5.
* Right Chart: Scale from 0 to 30, incrementing by 10.
* **Y-axis (ΔP):** Represents the change in performance.
* Both Charts: Scale from -80 to 0, incrementing by 20 on the left chart. Scale from -100 to 0, incrementing by 20 on the right chart.
* **Legend (Bottom):**
* Blue solid line: Q-Anchored (PopQA)
* Brown dashed line: A-Anchored (PopQA)
* Green dotted line: Q-Anchored (TriviaQA)
* Purple dash-dotted line: Q-Anchored (HotpotQA)
* Orange dash-dot-dotted line: A-Anchored (TriviaQA)
* Gray dotted line: A-Anchored (HotpotQA)
* Pink dashed line: Q-Anchored (NQ)
* Black dotted line: A-Anchored (NQ)
### Detailed Analysis
**Left Chart (Llama-3.2-3B-Instruct):**
* **Q-Anchored (PopQA) (Blue solid line):** Starts at approximately 0 at layer 0, decreases to approximately -75 at layer 25.
* **A-Anchored (PopQA) (Brown dashed line):** Remains relatively constant around 0 throughout all layers.
* **Q-Anchored (TriviaQA) (Green dotted line):** Starts at approximately 0 at layer 0, decreases to approximately -70 at layer 25.
* **Q-Anchored (HotpotQA) (Purple dash-dotted line):** Starts at approximately 0 at layer 0, decreases to approximately -65 at layer 25.
* **A-Anchored (TriviaQA) (Orange dash-dot-dotted line):** Remains relatively constant around 0 throughout all layers.
* **A-Anchored (HotpotQA) (Gray dotted line):** Remains relatively constant around 0 throughout all layers.
* **Q-Anchored (NQ) (Pink dashed line):** Remains relatively constant around 0 throughout all layers.
* **A-Anchored (NQ) (Black dotted line):** Remains relatively constant around 0 throughout all layers.
**Right Chart (Llama-3-8B-Instruct):**
* **Q-Anchored (PopQA) (Blue solid line):** Starts at approximately 0 at layer 0, decreases to approximately -90 at layer 30.
* **A-Anchored (PopQA) (Brown dashed line):** Remains relatively constant around 0 throughout all layers.
* **Q-Anchored (TriviaQA) (Green dotted line):** Starts at approximately 0 at layer 0, decreases to approximately -60 at layer 30.
* **Q-Anchored (HotpotQA) (Purple dash-dotted line):** Starts at approximately 0 at layer 0, decreases to approximately -50 at layer 30.
* **A-Anchored (TriviaQA) (Orange dash-dot-dotted line):** Remains relatively constant around 0 throughout all layers.
* **A-Anchored (HotpotQA) (Gray dotted line):** Remains relatively constant around 0 throughout all layers.
* **Q-Anchored (NQ) (Pink dashed line):** Remains relatively constant around 0 throughout all layers.
* **A-Anchored (NQ) (Black dotted line):** Remains relatively constant around 0 throughout all layers.
### Key Observations
* For both models, the "Q-Anchored" tasks (PopQA, TriviaQA, HotpotQA) show a significant decrease in performance (ΔP) as the layer number increases.
* The "A-Anchored" tasks (PopQA, TriviaQA, HotpotQA, NQ) maintain a relatively constant performance (ΔP) around 0 across all layers for both models.
* The Llama-3-8B-Instruct model shows a more pronounced decrease in performance for the Q-Anchored (PopQA) task compared to the Llama-3.2-3B-Instruct model.
### Interpretation
The data suggests that anchoring the question (Q-Anchored) in the question-answering tasks leads to a degradation in performance as the model processes deeper layers. This could indicate that the model is losing relevant information or becoming more susceptible to noise as it goes through the layers when the question is anchored. Conversely, anchoring the answer (A-Anchored) results in stable performance across all layers, suggesting a more robust processing mechanism when the answer is the focal point. The difference in performance degradation between the two models for the Q-Anchored (PopQA) task may indicate that the larger model (Llama-3-8B-Instruct) is more sensitive to the anchoring of the question in this specific task.