## Chart: I-Don't-Know Rate vs. Layer for Llama-3-8B and Llama-3-70B
### Overview
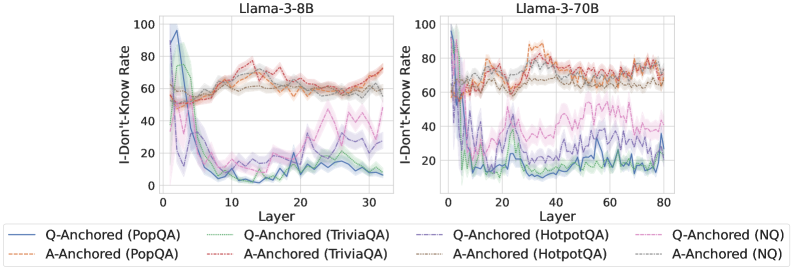
The image presents two line charts comparing the "I-Don't-Know Rate" across different layers of two language models, Llama-3-8B and Llama-3-70B. Each chart plots the rate for question-anchored (Q-Anchored) and answer-anchored (A-Anchored) data across various question-answering datasets: PopQA, TriviaQA, HotpotQA, and NQ. The x-axis represents the layer number, and the y-axis represents the I-Don't-Know Rate, ranging from 0 to 100.
### Components/Axes
* **Chart Titles:** "Llama-3-8B" (left chart) and "Llama-3-70B" (right chart).
* **Y-Axis Label:** "I-Don't-Know Rate"
* Scale: 0 to 100, with tick marks at 0, 20, 40, 60, 80, and 100.
* **X-Axis Label:** "Layer"
* Llama-3-8B: 0 to 30, with tick marks every 10 layers.
* Llama-3-70B: 0 to 80, with tick marks every 20 layers.
* **Legend:** Located at the bottom of the image.
* **Q-Anchored (PopQA):** Solid blue line
* **A-Anchored (PopQA):** Dashed brown line
* **Q-Anchored (TriviaQA):** Solid green line
* **A-Anchored (TriviaQA):** Dashed light green line
* **Q-Anchored (HotpotQA):** Solid orange line
* **A-Anchored (HotpotQA):** Dashed orange line
* **Q-Anchored (NQ):** Dashed purple line
* **A-Anchored (NQ):** Dotted gray line
### Detailed Analysis
#### Llama-3-8B (Left Chart)
* **Q-Anchored (PopQA):** (Solid Blue) Starts at approximately 95 at layer 0, drops sharply to around 10 by layer 10, and then remains relatively stable between 5 and 15 for the remaining layers.
* **A-Anchored (PopQA):** (Dashed Brown) Starts at approximately 50 at layer 0, increases to around 60-65 by layer 10, and then fluctuates between 60 and 70 for the remaining layers.
* **Q-Anchored (TriviaQA):** (Solid Green) Starts at approximately 60 at layer 0, drops to around 5-10 by layer 15, and then remains relatively stable between 0 and 10 for the remaining layers.
* **A-Anchored (TriviaQA):** (Dashed Light Green) Starts at approximately 50 at layer 0, drops to around 10-15 by layer 15, and then remains relatively stable between 5 and 15 for the remaining layers.
* **Q-Anchored (NQ):** (Dashed Purple) Starts at approximately 50 at layer 0, drops to around 10-20 by layer 10, and then fluctuates between 10 and 30 for the remaining layers.
* **A-Anchored (NQ):** (Dotted Gray) Starts at approximately 60 at layer 0, increases to around 60-70 by layer 10, and then fluctuates between 60 and 70 for the remaining layers.
#### Llama-3-70B (Right Chart)
* **Q-Anchored (PopQA):** (Solid Blue) Starts at approximately 95 at layer 0, drops sharply to around 20 by layer 20, and then fluctuates between 15 and 25 for the remaining layers.
* **A-Anchored (PopQA):** (Dashed Brown) Starts at approximately 60 at layer 0, increases to around 70-80 by layer 20, and then fluctuates between 65 and 75 for the remaining layers.
* **Q-Anchored (TriviaQA):** (Solid Green) Starts at approximately 60 at layer 0, drops to around 10-20 by layer 20, and then fluctuates between 10 and 20 for the remaining layers.
* **A-Anchored (TriviaQA):** (Dashed Light Green) Starts at approximately 50 at layer 0, drops to around 20-30 by layer 20, and then fluctuates between 20 and 30 for the remaining layers.
* **Q-Anchored (HotpotQA):** (Solid Orange) Starts at approximately 60 at layer 0, increases to around 70-80 by layer 20, and then fluctuates between 70 and 90 for the remaining layers.
* **A-Anchored (HotpotQA):** (Dashed Orange) Starts at approximately 60 at layer 0, increases to around 70-80 by layer 20, and then fluctuates between 65 and 75 for the remaining layers.
* **Q-Anchored (NQ):** (Dashed Purple) Starts at approximately 50 at layer 0, drops to around 20-30 by layer 20, and then fluctuates between 20 and 40 for the remaining layers.
* **A-Anchored (NQ):** (Dotted Gray) Starts at approximately 60 at layer 0, increases to around 60-70 by layer 20, and then fluctuates between 60 and 70 for the remaining layers.
### Key Observations
* For both models, the Q-Anchored (PopQA), Q-Anchored (TriviaQA), and Q-Anchored (NQ) rates decrease significantly in the initial layers.
* For both models, the A-Anchored (PopQA), A-Anchored (TriviaQA), A-Anchored (HotpotQA), and A-Anchored (NQ) rates tend to increase or remain relatively stable across layers.
* The Llama-3-70B model shows more fluctuation in the I-Don't-Know Rate across layers compared to the Llama-3-8B model.
* The HotpotQA dataset shows a higher I-Don't-Know Rate for Q-Anchored data in the Llama-3-70B model.
### Interpretation
The data suggests that the initial layers of the language models are crucial for reducing the "I-Don't-Know Rate" for question-anchored data. The difference between Q-Anchored and A-Anchored rates indicates that the model's confidence varies depending on whether the question or the answer is used as the anchor. The fluctuations in the Llama-3-70B model might be due to its larger size and complexity, leading to more variability in its responses across different layers. The higher I-Don't-Know Rate for HotpotQA in the Llama-3-70B model could indicate that this dataset poses a greater challenge for the model.