## Line Chart: Validation Loss vs. Tokens Seen Across Training Scenarios
### Overview
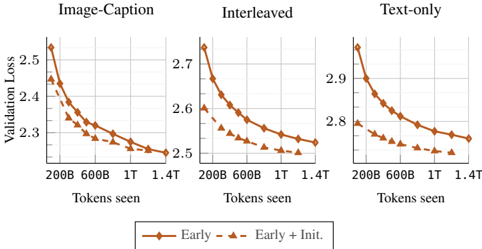
The image displays three line charts comparing validation loss trends across different training scenarios (Image-Caption, Interleaved, Text-only) as a function of tokens seen during training. Each chart shows two data series: "Early" (solid line) and "Early + Init." (dashed line), with validation loss decreasing as tokens seen increase.
### Components/Axes
- **X-axis**: "Tokens seen" with markers at 200B, 600B, 1T, 1.4T (approximate values: 200,000,000; 600,000,000; 1,000,000,000; 1,400,000,000).
- **Y-axis**: "Validation Loss" ranging from 2.2 to 2.9.
- **Legend**: Located at the bottom center, with:
- Solid orange line: "Early"
- Dashed orange line: "Early + Init."
- **Subplot Titles**:
- Top-left: "Image-Caption"
- Top-center: "Interleaved"
- Top-right: "Text-only"
### Detailed Analysis
#### Image-Caption Subplot
- **Early (solid)**: Starts at ~2.5 (200B tokens), decreases to ~2.3 (1.4T tokens).
- **Early + Init. (dashed)**: Starts at ~2.4 (200B tokens), decreases to ~2.25 (1.4T tokens).
- **Trend**: Both lines slope downward, with "Early + Init." consistently below "Early."
#### Interleaved Subplot
- **Early (solid)**: Starts at ~2.7 (200B tokens), decreases to ~2.5 (1.4T tokens).
- **Early + Init. (dashed)**: Starts at ~2.6 (200B tokens), decreases to ~2.45 (1.4T tokens).
- **Trend**: Similar downward slope, with "Early + Init." outperforming "Early" by ~0.15 units at 1.4T tokens.
#### Text-only Subplot
- **Early (solid)**: Starts at ~2.9 (200B tokens), decreases to ~2.7 (1.4T tokens).
- **Early + Init. (dashed)**: Starts at ~2.8 (200B tokens), decreases to ~2.65 (1.4T tokens).
- **Trend**: Highest initial loss among subplots, but "Early + Init." still shows faster convergence.
### Key Observations
1. **Consistent Performance Gain**: "Early + Init." reduces validation loss by ~0.1–0.15 units compared to "Early" across all scenarios at 1.4T tokens.
2. **Scenario Dependency**: Text-only scenarios exhibit higher baseline losses (~2.9 vs. ~2.5 for Image-Caption), suggesting text-only training is less efficient.
3. **Convergence Rate**: "Early + Init." demonstrates steeper initial declines, particularly in the first 600B tokens.
### Interpretation
The data indicates that initializing training with additional data ("Early + Init.") significantly improves model performance across all scenarios. The Text-only scenario’s higher validation loss suggests that multimodal training (Image-Caption/Interleaved) leverages richer contextual information. The consistent outperformance of "Early + Init." implies that initialization strategies are critical for reducing overfitting and accelerating convergence, particularly in resource-constrained settings where token efficiency matters.