## Line Chart: Attention Key Query Score, a=64
### Overview
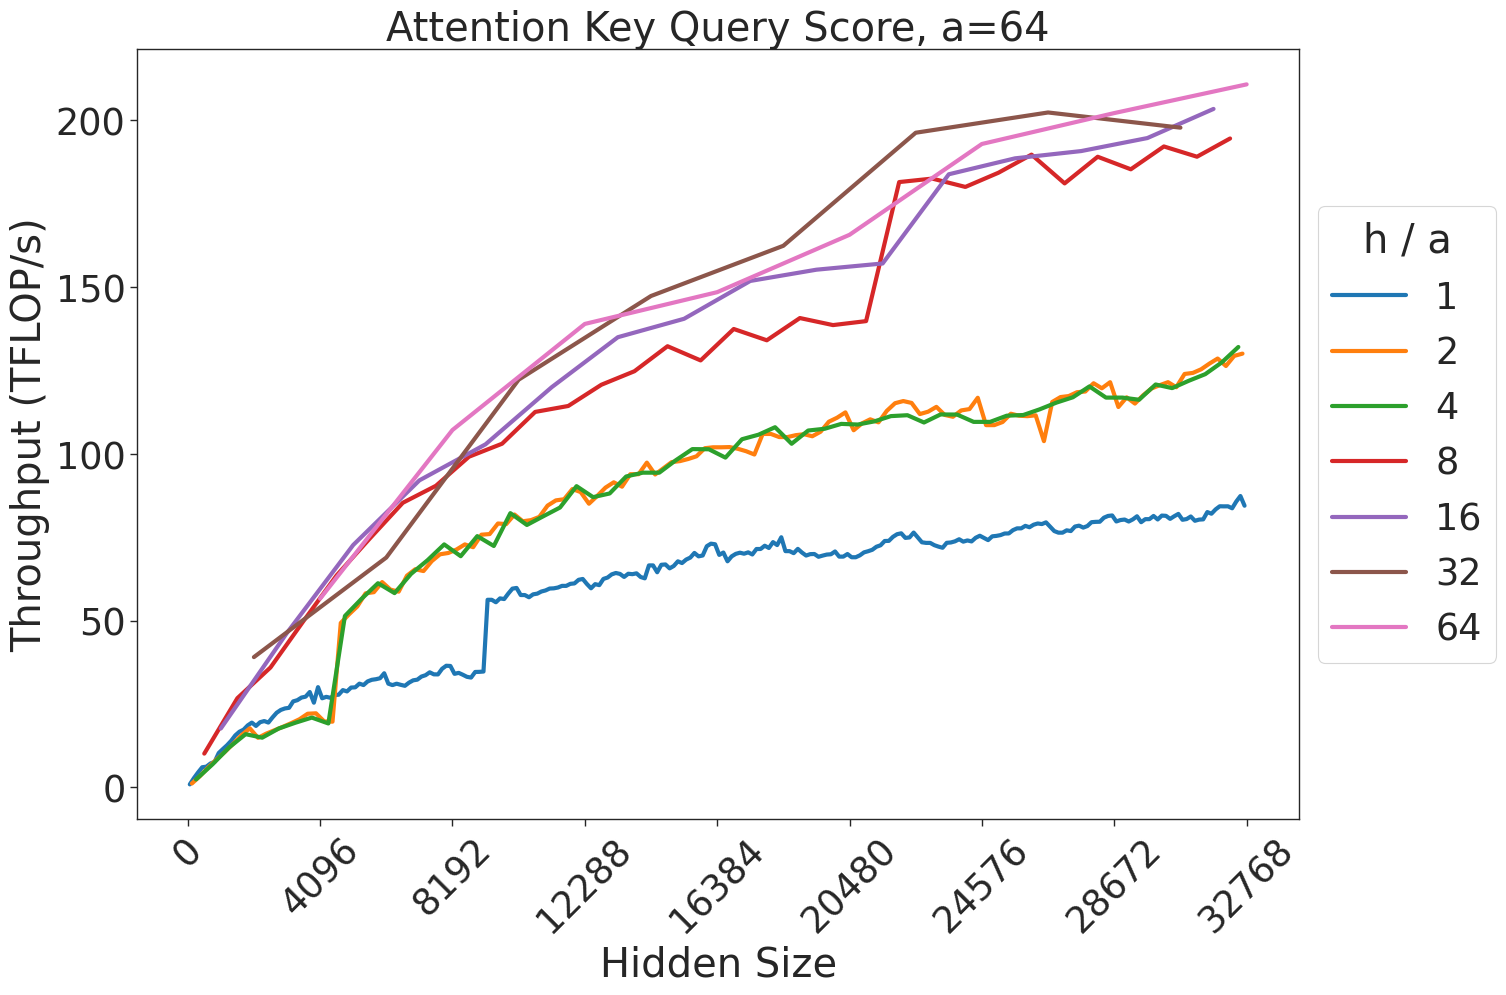
This image displays a line chart illustrating the performance (throughput in TFLOP/s) of an attention mechanism relative to the "Hidden Size" of a model. The chart compares different ratios of heads to attention dimension ($h/a$), ranging from 1 to 64. The data suggests that higher $h/a$ ratios generally correlate with higher throughput, though with diminishing returns at the highest values.
### Components/Axes
* **Title:** "Attention Key Query Score, a=64" (Top center).
* **Y-Axis:** "Throughput (TFLOP/s)". The scale ranges from 0 to 200, with major ticks at 0, 50, 100, 150, and 200.
* **X-Axis:** "Hidden Size". The scale ranges from 0 to 32768, with major ticks at 0, 4096, 8192, 12288, 16384, 20480, 24576, 28672, and 32768.
* **Legend:** Located on the right side, labeled "h / a". It maps colors to specific ratios:
* **Blue:** 1
* **Orange:** 2
* **Green:** 4
* **Red:** 8
* **Purple:** 16
* **Brown:** 32
* **Pink:** 64
### Detailed Analysis
The chart plots seven distinct data series. Below is the trend analysis for each, moving from the lowest throughput to the highest:
* **h/a = 1 (Blue):** This line represents the lowest throughput. It shows a steady, gradual upward slope, ending at approximately 85-90 TFLOP/s at a hidden size of 32768. There is a notable vertical "step" increase around the 10,000 hidden size mark.
* **h/a = 2 (Orange) & h/a = 4 (Green):** These two lines are nearly identical, overlapping almost perfectly throughout the entire range. They show a steady upward trend, ending at approximately 130 TFLOP/s at a hidden size of 32768.
* **h/a = 8 (Red):** This line shows a steeper upward trend than the previous series. It exhibits a significant, sharp jump in throughput around the 20,000 hidden size mark, eventually reaching approximately 195 TFLOP/s.
* **h/a = 16 (Purple):** This line follows a similar trajectory to the red line but maintains a slightly higher throughput for most of the range, ending at approximately 200 TFLOP/s.
* **h/a = 32 (Brown):** This line rises very sharply in the early stages (0 to 20,000). It hits a peak of approximately 200 TFLOP/s around the 24,000 mark, after which it plateaus and shows a slight downward trend or stagnation.
* **h/a = 64 (Pink):** This line represents the highest throughput. It shows a consistent, strong upward slope throughout the entire range, ending as the highest data point at approximately 210-215 TFLOP/s.
### Key Observations
* **Performance Saturation:** The lines for $h/a$ values of 32 and 64 begin to converge and plateau as the hidden size increases, suggesting that the hardware or kernel implementation reaches a compute-bound limit.
* **Discontinuities:** Several lines (notably Red, Purple, and Blue) exhibit sharp, vertical jumps at specific hidden sizes (e.g., around 20,000 for Red/Purple). This is characteristic of GPU kernel switching or changes in tiling strategies where the algorithm adapts to the memory constraints of the specific hidden size.
* **Clustering:** The data series cluster into three distinct performance tiers:
1. Low tier: $h/a = 1$
2. Mid tier: $h/a = 2$ and $4$
3. High tier: $h/a = 8, 16, 32, 64$
### Interpretation
This chart is a performance benchmark for Transformer attention kernels, likely running on a GPU. The "Hidden Size" represents the dimensionality of the model's internal representation, and the $h/a$ ratio represents the configuration of attention heads relative to the attention dimension.
The data demonstrates that increasing the $h/a$ ratio generally improves throughput, likely due to better parallelization and occupancy of the GPU's compute units. However, the "steps" in the lines indicate that performance is not strictly linear; it is highly dependent on specific hidden size thresholds where the underlying kernel implementation likely changes (e.g., switching from a smaller tile size to a larger one to optimize memory access). The convergence of the higher $h/a$ lines at the right side of the chart suggests that at very large hidden sizes, the performance gains from increasing the head-to-dimension ratio diminish, as the system becomes limited by other factors such as memory bandwidth or total compute capacity.