\n
## Chart: Distribution of Router Stability
### Overview
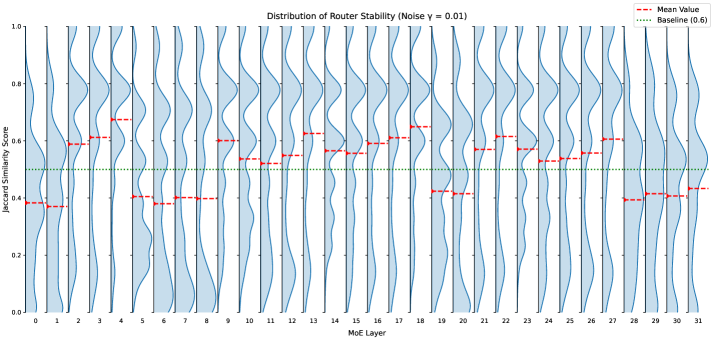
The image presents a series of violin plots illustrating the distribution of router stability, measured by the Jaccard Similarity Score, across 31 MoE (Mixture of Experts) layers. A horizontal line indicates a baseline value of 0.6. A dashed red line indicates the mean value for each layer. The noise level is specified as γ = 0.01.
### Components/Axes
* **X-axis:** MoE Layer, ranging from 1 to 31.
* **Y-axis:** Jaccard Similarity Score, ranging from 0.0 to 1.0.
* **Legend:**
* Red dashed line: Mean Value
* Green solid line: Baseline (0.6)
* **Plot Type:** Violin plots, showing the distribution of Jaccard Similarity Scores for each MoE layer.
### Detailed Analysis
The chart consists of 31 violin plots, one for each MoE layer. Each violin plot displays the distribution of Jaccard Similarity Scores. The width of each violin represents the density of data points at that score level.
The baseline value (0.6) is represented by a horizontal green line that spans the entire chart. The mean Jaccard Similarity Score for each layer is indicated by a horizontal dashed red line.
Visually, the violin plots appear relatively consistent across all 31 layers. The distributions are generally centered around a Jaccard Similarity Score of approximately 0.4 to 0.6. The mean values (red dashed lines) are consistently below the baseline (green line).
Here's a layer-by-layer approximation of the mean values (based on the red dashed lines):
* Layers 1-31: The mean value appears to hover around 0.45 - 0.55. There is no significant variation in the mean value across the layers.
### Key Observations
* The distributions of Jaccard Similarity Scores are similar across all MoE layers.
* The mean Jaccard Similarity Score for each layer is consistently below the baseline of 0.6.
* There is no apparent trend or pattern in the mean values across the layers.
* The violin plots show a relatively wide spread of Jaccard Similarity Scores, indicating variability in router stability.
### Interpretation
The data suggests that the router stability, as measured by the Jaccard Similarity Score, is relatively consistent across the 31 MoE layers under the specified noise level (γ = 0.01). However, the mean stability is consistently lower than the baseline value of 0.6. This indicates that, on average, the routers are less stable than the desired baseline.
The lack of a trend in the mean values suggests that adding more MoE layers does not necessarily improve or degrade router stability. The wide spread of scores within each violin plot indicates that there is significant variability in router stability, even within a single layer. This could be due to factors such as random initialization, data variations, or inherent instability in the routing process.
The consistent positioning of the mean values below the baseline suggests a systematic issue affecting router stability. Further investigation is needed to identify the root cause of this issue and explore potential solutions to improve router stability and bring the mean values closer to the baseline. The noise level of 0.01 may be contributing to the lower stability scores.