## Scatter Plot: Accuracy vs. Time-to-Answer
### Overview
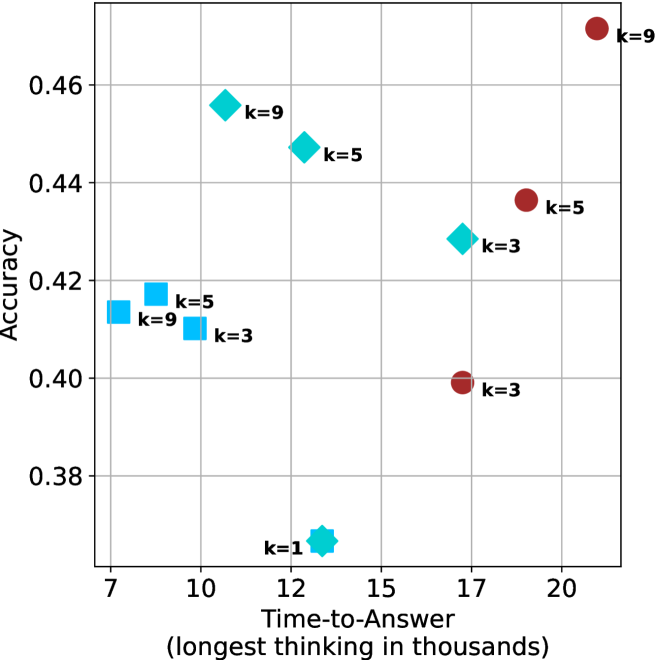
This image is a scatter plot visualizing the performance of different configurations (likely AI model parameters or prompting strategies) based on two metrics: "Accuracy" (y-axis) and "Time-to-Answer" (x-axis). The data points are grouped by shape and color, with each point labeled with a specific "k" value (likely representing a parameter such as top-k sampling, number of reasoning chains, or similar).
### Components/Axes
* **Y-Axis:** Labeled "Accuracy". The scale ranges from 0.38 to 0.46, with grid lines at 0.38, 0.40, 0.42, 0.44, 0.46.
* **X-Axis:** Labeled "Time-to-Answer (longest thinking in thousands)". The scale ranges from 7 to 20, with grid lines at 7, 10, 12, 15, 17, 20.
* **Data Series (Categorized by Shape/Color):**
* **Cyan Squares:** Located in the top-left region.
* **Cyan Diamonds:** Located in the top-middle region.
* **Cyan Star:** Located at the bottom-middle.
* **Dark Red Circles:** Located in the top-right region.
### Detailed Analysis
The data points are clustered into four distinct groups. Below are the approximate coordinates (x, y) for each point:
**1. Cyan Squares (Left Cluster)**
* **k=9:** Positioned at x ≈ 8.2, y ≈ 0.418.
* **k=5:** Positioned at x ≈ 8.5, y ≈ 0.414.
* **k=3:** Positioned at x ≈ 10.0, y ≈ 0.410.
* *Trend:* As the 'k' value decreases, the time-to-answer increases slightly, and accuracy decreases.
**2. Cyan Diamonds (Middle Cluster)**
* **k=9:** Positioned at x ≈ 11.0, y ≈ 0.456.
* **k=5:** Positioned at x ≈ 13.0, y ≈ 0.448.
* **k=3:** Positioned at x ≈ 17.0, y ≈ 0.429.
* *Trend:* As the 'k' value decreases, the time-to-answer increases significantly, and accuracy decreases.
**3. Cyan Star (Bottom Center)**
* **k=1:** Positioned at x ≈ 13.0, y ≈ 0.368.
* *Note:* This is a significant outlier with the lowest accuracy of the entire dataset.
**4. Dark Red Circles (Right Cluster)**
* **k=9:** Positioned at x ≈ 21.0, y ≈ 0.472.
* **k=5:** Positioned at x ≈ 19.0, y ≈ 0.437.
* **k=3:** Positioned at x ≈ 17.0, y ≈ 0.399.
* *Trend:* As the 'k' value decreases, both the time-to-answer and the accuracy decrease.
### Key Observations
* **Performance Ceiling:** The highest accuracy (≈ 0.472) is achieved by the Dark Red Circle (k=9), which also corresponds to the longest time-to-answer (≈ 21,000).
* **Consistency of 'k':** Across all three main clusters (Squares, Diamonds, Circles), a higher 'k' value consistently correlates with higher accuracy.
* **Efficiency Trade-off:** The Cyan Squares represent the fastest models (lowest time-to-answer), but they operate at a lower accuracy tier compared to the Diamonds and Circles.
* **Outlier:** The Cyan Star (k=1) is the only data point that falls below the 0.38 accuracy threshold, suggesting that a 'k' value of 1 is highly inefficient or ineffective for this specific task.
### Interpretation
This chart demonstrates a clear performance trade-off between computational time and model accuracy.
* **Model Scaling:** The distinct clusters (Squares, Diamonds, Circles) likely represent different model sizes or architectures. The Dark Red Circles appear to be the most "capable" (highest accuracy) but are the most computationally expensive. The Cyan Squares are the most "efficient" (fastest) but have lower accuracy.
* **Parameter Sensitivity:** The 'k' parameter appears to be a tuning knob for accuracy. In every group, reducing 'k' from 9 to 3 results in a drop in accuracy.
* **The "k=1" Anomaly:** The fact that the k=1 point (Cyan Star) is isolated at the bottom suggests that reducing the parameter too far causes a disproportionate collapse in performance, making it a poor configuration choice compared to k=3, 5, or 9.
* **Strategic Insight:** If a user requires maximum accuracy, the Dark Red model at k=9 is the optimal choice, provided the latency (time-to-answer) is acceptable. If latency is the priority, the Cyan Square model at k=9 offers the best balance of speed and accuracy within that specific cluster.