\n
## Charts: Performance Comparison of Hierarchical-3DGS and FLOD-3DGS
### Overview
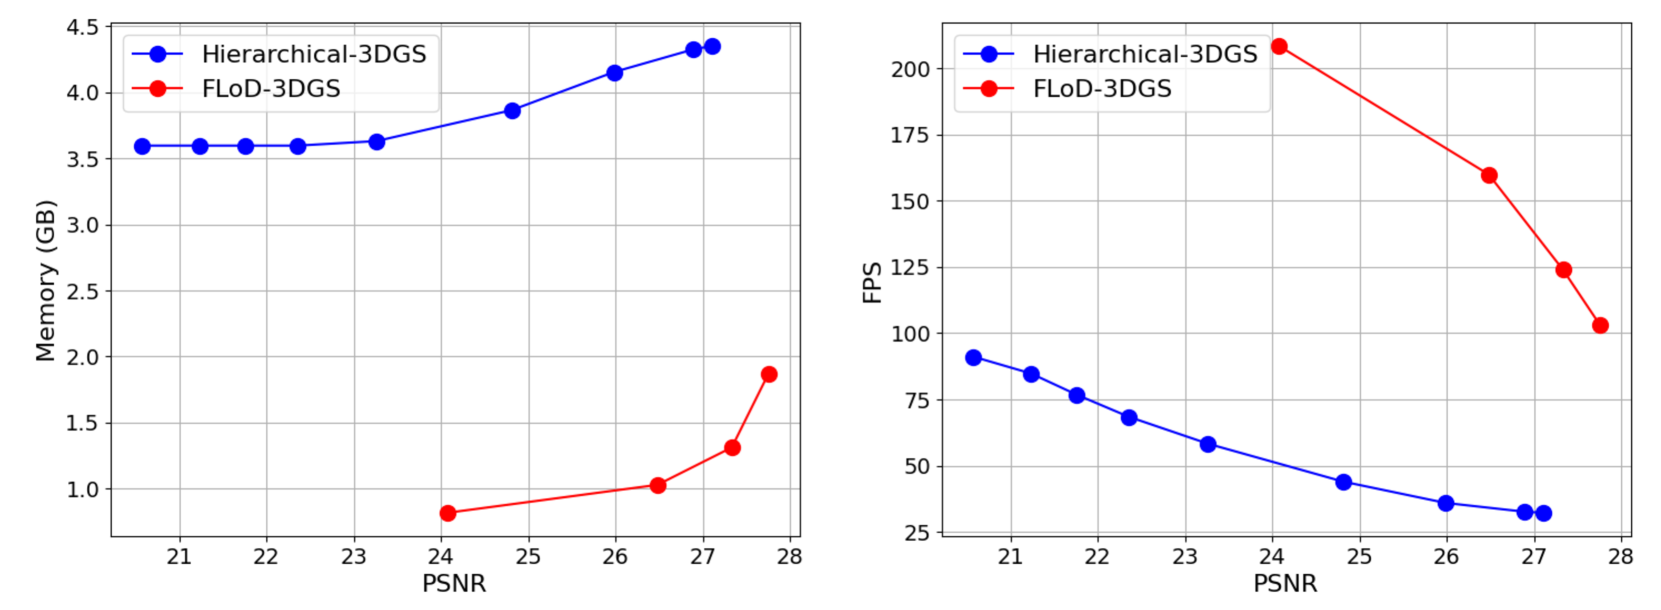
The image presents two line charts comparing the performance of "Hierarchical-3DGS" and "FLOD-3DGS" methods. The left chart shows the relationship between PSNR (Peak Signal-to-Noise Ratio) and Memory usage (in GB), while the right chart shows the relationship between PSNR and FPS (Frames Per Second). Both charts use the same x-axis (PSNR) and display data for both methods as distinct lines with corresponding markers.
### Components/Axes
* **X-axis (Both Charts):** PSNR (Peak Signal-to-Noise Ratio), ranging from approximately 21 to 28.
* **Left Chart Y-axis:** Memory (GB), ranging from approximately 0.8 to 4.5.
* **Right Chart Y-axis:** FPS (Frames Per Second), ranging from approximately 20 to 200.
* **Legend (Top-Left of each chart):**
* Blue Line/Markers: Hierarchical-3DGS
* Red Line/Markers: FLOD-3DGS
### Detailed Analysis
**Left Chart: Memory vs. PSNR**
* **Hierarchical-3DGS (Blue Line):** The line slopes generally upward, indicating that as PSNR increases, memory usage also increases.
* PSNR = 21, Memory ≈ 3.6 GB
* PSNR = 22, Memory ≈ 3.7 GB
* PSNR = 23, Memory ≈ 3.8 GB
* PSNR = 24, Memory ≈ 3.9 GB
* PSNR = 25, Memory ≈ 4.0 GB
* PSNR = 26, Memory ≈ 4.15 GB
* PSNR = 27, Memory ≈ 4.25 GB
* PSNR = 28, Memory ≈ 4.3 GB
* **FLOD-3DGS (Red Line):** The line shows a steep upward trend, especially at higher PSNR values.
* PSNR = 21, Memory ≈ 0.8 GB
* PSNR = 22, Memory ≈ 0.85 GB
* PSNR = 23, Memory ≈ 0.9 GB
* PSNR = 24, Memory ≈ 0.95 GB
* PSNR = 25, Memory ≈ 1.0 GB
* PSNR = 26, Memory ≈ 1.1 GB
* PSNR = 27, Memory ≈ 1.8 GB
* PSNR = 28, Memory ≈ 2.0 GB
**Right Chart: FPS vs. PSNR**
* **Hierarchical-3DGS (Blue Line):** The line slopes downward, indicating that as PSNR increases, FPS decreases.
* PSNR = 21, FPS ≈ 90
* PSNR = 22, FPS ≈ 80
* PSNR = 23, FPS ≈ 70
* PSNR = 24, FPS ≈ 60
* PSNR = 25, FPS ≈ 50
* PSNR = 26, FPS ≈ 40
* PSNR = 27, FPS ≈ 30
* PSNR = 28, FPS ≈ 25
* **FLOD-3DGS (Red Line):** The line also slopes downward, but the decrease in FPS is more pronounced, especially at higher PSNR values.
* PSNR = 21, FPS ≈ 200
* PSNR = 22, FPS ≈ 180
* PSNR = 23, FPS ≈ 160
* PSNR = 24, FPS ≈ 140
* PSNR = 25, FPS ≈ 120
* PSNR = 26, FPS ≈ 100
* PSNR = 27, FPS ≈ 110
* PSNR = 28, FPS ≈ 105
### Key Observations
* Hierarchical-3DGS consistently uses significantly more memory than FLOD-3DGS across all PSNR values.
* FLOD-3DGS achieves much higher FPS values than Hierarchical-3DGS, especially at lower PSNR values.
* Both methods exhibit a trade-off between memory usage/FPS and PSNR. Increasing PSNR generally leads to higher memory usage and lower FPS.
* The FPS drop for FLOD-3DGS is more dramatic at higher PSNR values than for Hierarchical-3DGS.
### Interpretation
The data suggests that FLOD-3DGS is more efficient in terms of memory usage and achieves higher frame rates, particularly at lower PSNR values. This indicates that FLOD-3DGS might be preferable for applications where speed and memory are critical, even if it means sacrificing some image quality (lower PSNR). Hierarchical-3DGS, while using more resources, maintains a more stable FPS performance as PSNR increases.
The trade-off between PSNR, memory, and FPS highlights the need to carefully consider the application's requirements when choosing between these two methods. The steeper decline in FPS for FLOD-3DGS at higher PSNR suggests a potential bottleneck or limitation in its implementation that becomes more apparent as image quality demands increase. The consistent memory usage of Hierarchical-3DGS suggests a more predictable resource allocation strategy. The data implies that the optimal choice depends on the specific balance between image quality, processing speed, and available memory.