## Line Charts: Performance Comparison of Hierarchical-3DGS vs. FLoD-3DGS
### Overview
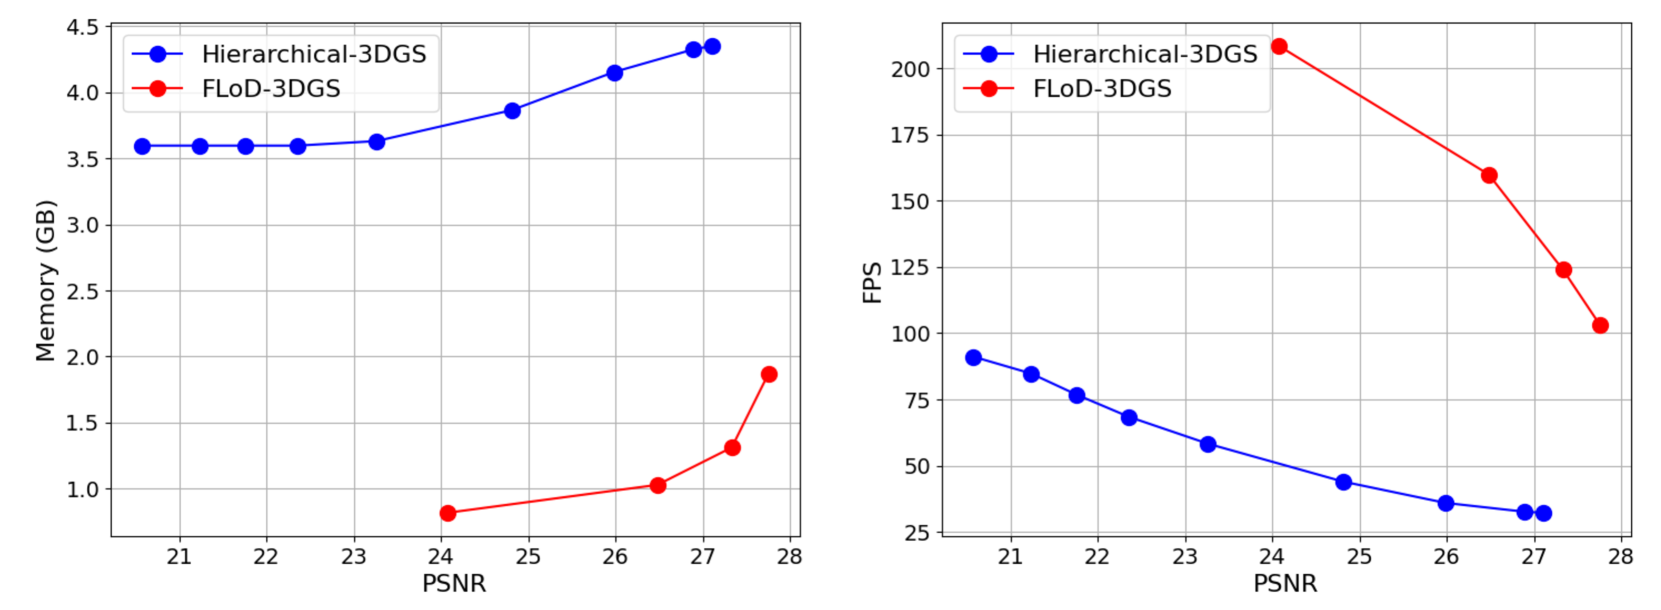
The image contains two side-by-side line charts comparing the performance of two 3D Gaussian Splatting (3DGS) methods: **Hierarchical-3DGS** (blue line with circular markers) and **FLoD-3DGS** (red line with circular markers). The charts plot two different performance metrics (Memory and FPS) against image quality (PSNR).
### Components/Axes
**Left Chart:**
* **Chart Type:** Line chart with markers.
* **Y-Axis:** Label: `Memory (GB)`. Scale: Linear, ranging from approximately 0.5 to 4.5 GB. Major ticks at 1.0, 1.5, 2.0, 2.5, 3.0, 3.5, 4.0, 4.5.
* **X-Axis:** Label: `PSNR`. Scale: Linear, ranging from approximately 20.5 to 28. Major ticks at 21, 22, 23, 24, 25, 26, 27, 28.
* **Legend:** Located in the top-left corner. Contains two entries:
* Blue line with circle marker: `Hierarchical-3DGS`
* Red line with circle marker: `FLoD-3DGS`
**Right Chart:**
* **Chart Type:** Line chart with markers.
* **Y-Axis:** Label: `FPS`. Scale: Linear, ranging from approximately 25 to 210. Major ticks at 25, 50, 75, 100, 125, 150, 175, 200.
* **X-Axis:** Label: `PSNR`. Scale: Linear, identical to the left chart (20.5 to 28).
* **Legend:** Located in the top-left corner. Identical to the left chart.
### Detailed Analysis
**Left Chart (Memory vs. PSNR):**
* **Trend - Hierarchical-3DGS (Blue):** The line shows a gradual, monotonic upward trend. Memory usage increases as PSNR (quality) increases.
* Data Points (Approximate):
* PSNR ~20.7: Memory ~3.6 GB
* PSNR ~21.2: Memory ~3.6 GB
* PSNR ~21.7: Memory ~3.6 GB
* PSNR ~22.2: Memory ~3.6 GB
* PSNR ~23.2: Memory ~3.65 GB
* PSNR ~24.8: Memory ~3.9 GB
* PSNR ~26.0: Memory ~4.15 GB
* PSNR ~27.0: Memory ~4.35 GB
* PSNR ~27.3: Memory ~4.4 GB
* **Trend - FLoD-3DGS (Red):** The line shows a steep, accelerating upward trend, particularly after PSNR ~26. Memory usage increases sharply with quality.
* Data Points (Approximate):
* PSNR ~24.1: Memory ~0.8 GB
* PSNR ~26.5: Memory ~1.05 GB
* PSNR ~27.3: Memory ~1.35 GB
* PSNR ~27.8: Memory ~1.9 GB
**Right Chart (FPS vs. PSNR):**
* **Trend - Hierarchical-3DGS (Blue):** The line shows a steady, monotonic downward trend. FPS (performance) decreases as PSNR (quality) increases.
* Data Points (Approximate):
* PSNR ~20.7: FPS ~90
* PSNR ~21.2: FPS ~85
* PSNR ~21.7: FPS ~77
* PSNR ~22.2: FPS ~70
* PSNR ~23.2: FPS ~60
* PSNR ~24.8: FPS ~45
* PSNR ~26.0: FPS ~37
* PSNR ~27.0: FPS ~33
* PSNR ~27.3: FPS ~33
* **Trend - FLoD-3DGS (Red):** The line shows a very steep, accelerating downward trend. FPS drops dramatically as quality increases.
* Data Points (Approximate):
* PSNR ~24.1: FPS ~210
* PSNR ~26.5: FPS ~160
* PSNR ~27.3: FPS ~125
* PSNR ~27.8: FPS ~103
### Key Observations
1. **Memory Efficiency:** FLoD-3DGS consistently uses significantly less memory than Hierarchical-3DGS across all comparable PSNR values. At PSNR ~27.3, FLoD uses ~1.35 GB vs. Hierarchical's ~4.4 GB.
2. **Performance (FPS) at Low Quality:** At lower quality (PSNR ~24.1), FLoD-3DGS achieves a much higher FPS (~210) compared to Hierarchical-3DGS at a similar PSNR (~45 FPS at PSNR 24.8).
3. **Performance Degradation:** Both methods show a performance (FPS) trade-off for higher quality. However, the degradation is far more severe for FLoD-3DGS, with FPS dropping by over 50% from its peak as PSNR increases from ~24 to ~28.
4. **Quality Ceiling:** The data suggests FLoD-3DGS is being evaluated at a higher PSNR range (starting ~24) compared to Hierarchical-3DGS (starting ~20.7). The highest quality point shown is for FLoD-3DGS at PSNR ~27.8.
### Interpretation
These charts illustrate a classic engineering trade-off between resource consumption (memory), performance (speed/FPS), and output quality (PSNR) in 3D Gaussian Splatting rendering.
* **Hierarchical-3DGS** appears to be a more **stable and predictable** method. It has a higher baseline memory cost but scales more gracefully. Its performance (FPS) declines steadily with quality, suggesting a consistent computational load per quality increment.
* **FLoD-3DGS** demonstrates a **highly efficient but volatile** profile. It achieves remarkable memory savings and very high frame rates at moderate quality levels. However, its costs (both memory and, especially, frame time) explode as one pushes for higher fidelity. This suggests its optimization strategy (likely involving level-of-detail or dynamic resource allocation) becomes increasingly expensive to manage at finer detail levels.
**Conclusion:** The choice between methods depends on the application's priorities. For memory-constrained systems or applications targeting moderate quality with high frame rates, FLoD-3DGS is compelling. For applications requiring consistently high quality or where predictable performance scaling is critical, Hierarchical-3DGS may be preferable despite its higher memory footprint. The data implies FLoD-3DGS hits a "quality wall" where further improvements incur disproportionate performance costs.