\n
## Bar Charts: Reflection Frequency vs. Number of Blanks
### Overview
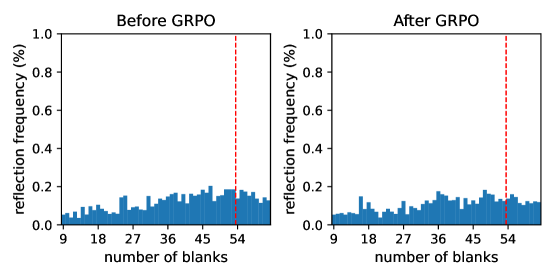
The image presents two bar charts, side-by-side, comparing the reflection frequency distribution before and after a process labeled "GRPO". Both charts depict the relationship between the number of blanks and the reflection frequency, expressed as a percentage. A vertical dashed red line is present in both charts, marking a value of approximately 54 on the x-axis.
### Components/Axes
* **X-axis:** "number of blanks" ranging from 9 to 54, with tick marks at intervals of 9.
* **Y-axis:** "reflection frequency (%)" ranging from 0.0 to 1.0, with tick marks at intervals of 0.2.
* **Chart Titles:**
* Left Chart: "Before GRPO"
* Right Chart: "After GRPO"
* **Data Series:** Each chart displays a single data series represented by blue bars.
* **Vertical Line:** A dashed red vertical line is present in both charts at approximately x = 54.
### Detailed Analysis or Content Details
**Left Chart: Before GRPO**
The bar chart shows a relatively low and consistent reflection frequency for most values of "number of blanks" up to approximately 45. The reflection frequency increases noticeably around the value of 45, peaking at approximately 0.23, and then decreases again. The dashed red line at 54 appears to highlight a region of higher reflection frequency.
* At x = 9, reflection frequency is approximately 0.02%.
* At x = 18, reflection frequency is approximately 0.04%.
* At x = 27, reflection frequency is approximately 0.07%.
* At x = 36, reflection frequency is approximately 0.12%.
* At x = 45, reflection frequency is approximately 0.23%.
* At x = 54, reflection frequency is approximately 0.18%.
**Right Chart: After GRPO**
The bar chart shows a similar pattern to the left chart, but with a generally lower and more uniform distribution of reflection frequency. The increase in reflection frequency around x = 45 is less pronounced than in the "Before GRPO" chart. The dashed red line at 54 again highlights a region, but the difference in reflection frequency before and after this point is less dramatic.
* At x = 9, reflection frequency is approximately 0.03%.
* At x = 18, reflection frequency is approximately 0.05%.
* At x = 27, reflection frequency is approximately 0.08%.
* At x = 36, reflection frequency is approximately 0.11%.
* At x = 45, reflection frequency is approximately 0.16%.
* At x = 54, reflection frequency is approximately 0.14%.
### Key Observations
* The "GRPO" process appears to have reduced the reflection frequency, particularly for values of "number of blanks" greater than 45.
* The peak in reflection frequency around x = 45 is less prominent after the GRPO process.
* The overall distribution of reflection frequency is more uniform after the GRPO process.
* The dashed red line at x = 54 seems to be a point of interest, potentially indicating a threshold or boundary.
### Interpretation
The data suggests that the GRPO process effectively reduces the reflection frequency, particularly in the range of "number of blanks" above 45. This could indicate that GRPO is a process designed to eliminate or mitigate factors contributing to higher reflection frequencies in this range. The reduction in the peak at x = 45 suggests that GRPO specifically addresses the cause of this increased reflection. The dashed red line at x = 54 might represent a critical value or a point where the effect of GRPO becomes more noticeable. The charts demonstrate a clear shift in the distribution of reflection frequency as a result of the GRPO process, indicating its effectiveness in modifying the underlying phenomenon being measured. The data implies that the GRPO process improves the consistency of reflection frequency across the measured range of "number of blanks".