## Bar Charts: Reflection Frequency Before and After GRPO
### Overview
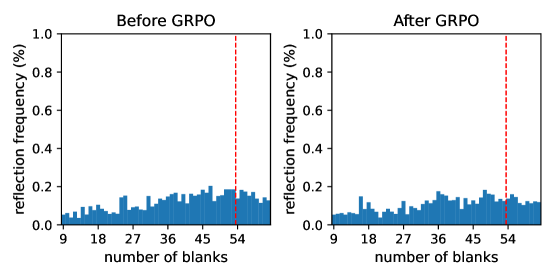
The image displays two side-by-side bar charts comparing the distribution of "reflection frequency (%)" against the "number of blanks" before and after an intervention or process labeled "GRPO". The charts suggest an analysis of how a system's reflective behavior changes with the quantity of blanks (likely in a text or task) and the impact of the GRPO method.
### Components/Axes
* **Chart Titles:**
* Left Chart: "Before GRPO"
* Right Chart: "After GRPO"
* **X-Axis (Both Charts):**
* Label: "number of blanks"
* Scale: Linear, with major tick marks and labels at 9, 18, 27, 36, 45, and 54.
* **Y-Axis (Both Charts):**
* Label: "reflection frequency (%)"
* Scale: Linear, ranging from 0.0 to 1.0 (representing 0% to 100%).
* **Key Visual Element:** A vertical red dashed line is present in both charts, positioned at the x-axis value of 54.
* **Data Representation:** Blue vertical bars. Each bar's height represents the reflection frequency for a specific number of blanks. The bars are densely packed, suggesting a histogram or a bar chart for a continuous or finely binned discrete variable.
### Detailed Analysis
**1. "Before GRPO" Chart (Left):**
* **Trend:** The reflection frequency shows a general, gradual upward trend as the number of blanks increases from 9 to approximately 54.
* **Data Points (Approximate):**
* At low blank counts (9-18), frequencies are low, mostly below 0.1 (10%).
* Frequencies rise steadily, with noticeable peaks and variability.
* The highest frequencies occur in the range of approximately 45 to 54 blanks, with several bars reaching or slightly exceeding 0.2 (20%).
* The distribution appears somewhat right-skewed, with higher frequencies concentrated at the higher end of the blank count scale.
**2. "After GRPO" Chart (Right):**
* **Trend:** The overall reflection frequency is visibly lower across the entire range of blank counts compared to the "Before" chart. The upward trend with increasing blanks is less pronounced and more flattened.
* **Data Points (Approximate):**
* Frequencies start low (below 0.1) for blank counts of 9-18.
* There is a modest increase, but the peak frequencies are significantly reduced.
* The highest bars in the 36-54 blank range generally remain below 0.15 (15%), with most below 0.12.
* The distribution is more uniform and compressed towards the lower end of the y-axis scale.
**3. The Red Dashed Line (x=54):**
* This line serves as a consistent reference point in both charts. It highlights the data at the maximum shown blank count (54). In the "Before" chart, this region has some of the highest frequencies. In the "After" chart, the frequencies at this point are markedly reduced.
### Key Observations
1. **Systematic Reduction:** The application of GRPO is associated with a clear, systematic reduction in reflection frequency across all observed numbers of blanks.
2. **Attenuated Trend:** The positive correlation between the number of blanks and reflection frequency is weakened after GRPO. The "After" distribution is flatter.
3. **Peak Suppression:** The most significant reduction appears to occur at higher blank counts (approximately 36-54), where the "Before" frequencies were highest.
4. **Consistent Scale:** Both charts use identical axes scales, allowing for direct visual comparison of the distributions' shapes and magnitudes.
### Interpretation
The data suggests that the GRPO process effectively suppresses the "reflection" behavior in the system being measured. "Reflection frequency" likely quantifies how often a system (e.g., an AI model, a cognitive architecture) engages in a specific reflective or recursive processing step.
* **Before GRPO:** The system's tendency to reflect increases with the complexity or length of the input (as proxied by "number of blanks"). This could indicate a scaling behavior where more complex tasks trigger more internal deliberation or self-referential processing.
* **After GRPO:** The intervention successfully decouples reflection frequency from input complexity to a significant degree. The system becomes less prone to reflection, especially for more complex (higher blank count) inputs. This could imply that GRPO makes the system more efficient, less "hesitant," or alters its fundamental processing strategy to rely less on the measured reflective mechanism.
The red line at 54 blanks may indicate a critical threshold, a maximum tested complexity, or a point where the GRPO intervention was specifically designed to have an effect. The charts demonstrate that GRPO's impact is most visually dramatic at this high-complexity end of the spectrum. The overall interpretation is that GRPO modifies the system's operational dynamics, leading to a measurable decrease in a specific type of internal processing (reflection).