## Line Chart: Model Accuracy Comparison
### Overview
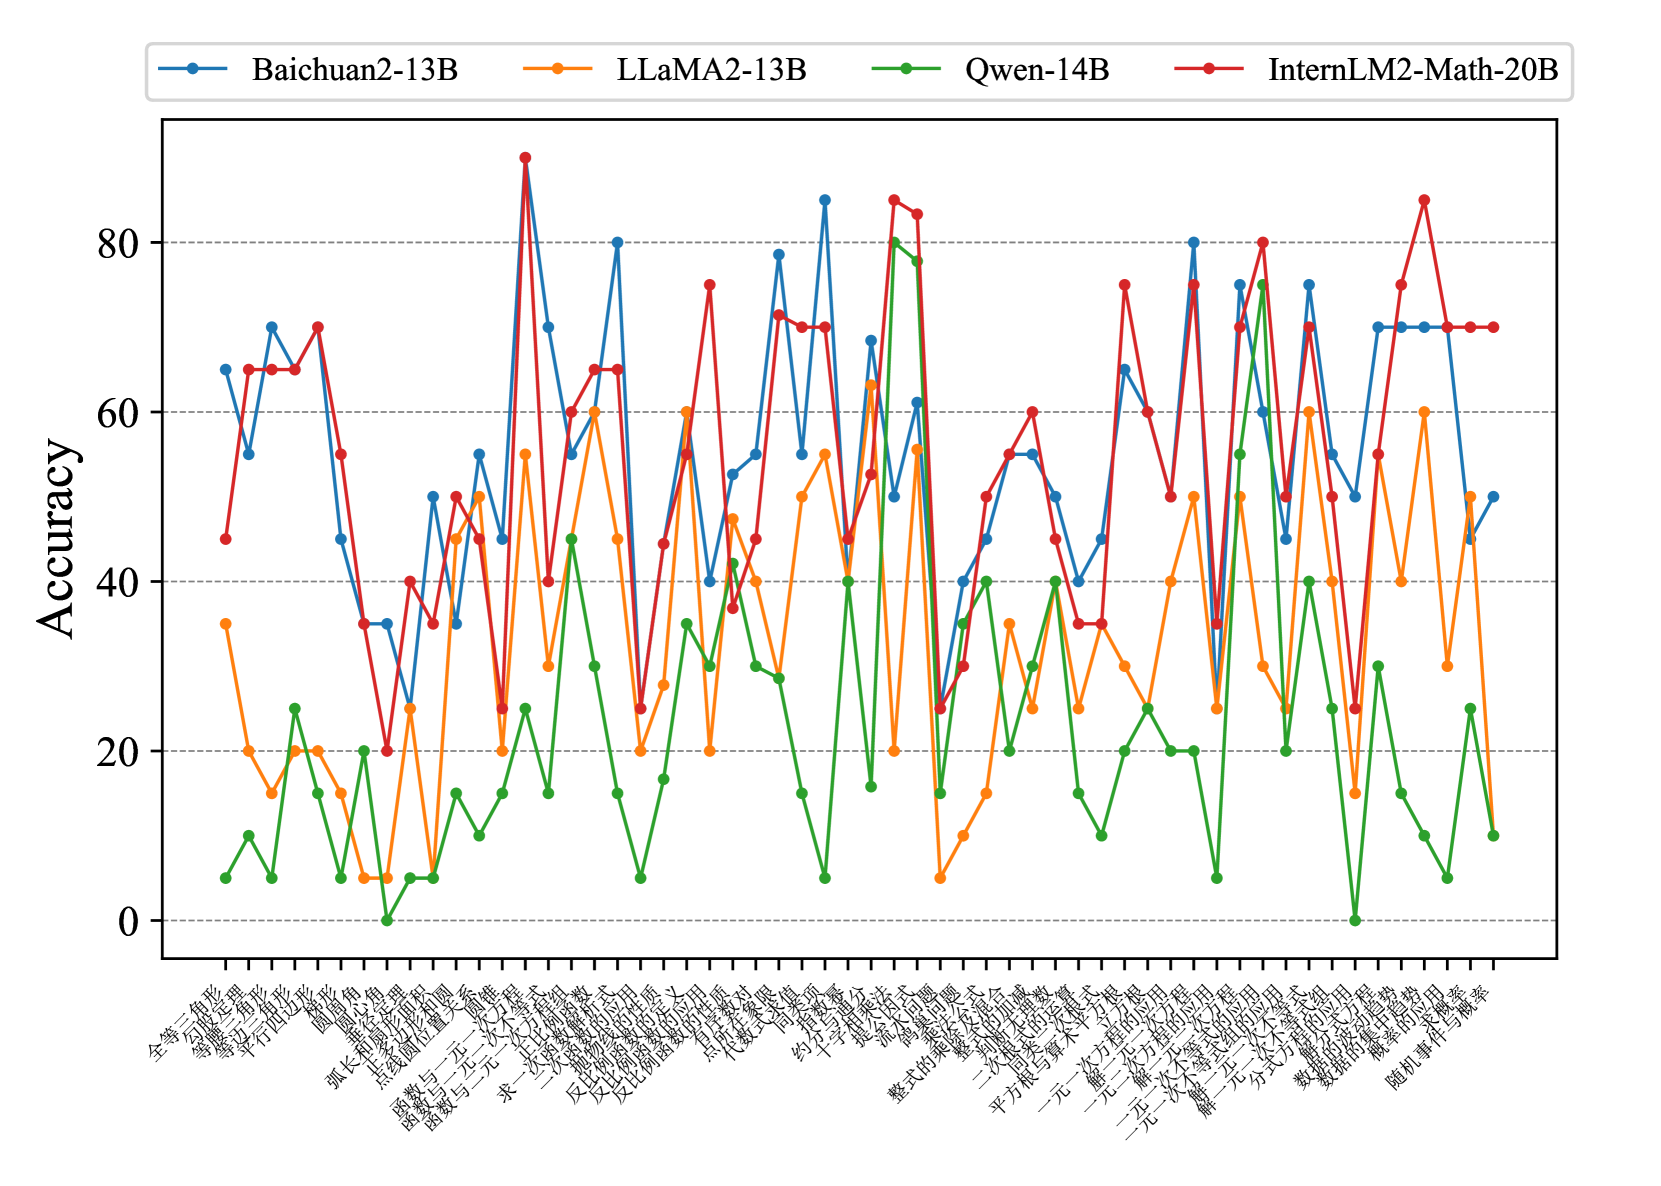
The image is a line chart comparing the accuracy of four different language models (Baichuan2-13B, LLaMA2-13B, Qwen-14B, and InternLM2-Math-20B) across a series of mathematical problems. The x-axis represents different problem types (in Chinese), and the y-axis represents the accuracy score.
### Components/Axes
* **Title:** (None visible)
* **X-axis:** Represents different mathematical problem types. The labels are in Chinese.
* The labels are: 全等三角形的性质与判定, 等腰三角形的性质与判定, 勾股定理, 平行四边形, 弧长和扇形面积, 圆锥, 圆心角, 点与圆的位置关系, 函数与一元一次方程, 求一次函数表达式, 反比例函数的应用, 代数式求值, 约分, 不等式性质, 提公因式法, 公式法, 整式的乘法, 平方根与算术平方根, 一元一次方程的应用, 一元一次不等式组的应用, 二次根式的运算, 平方差公式, 一元二次方程的解法, 一元二次方程根的判别式, 一元二次方程的应用, 数据的波动程度, 数据的集中趋势, 随机事件与概率
* **Y-axis:** Represents Accuracy, ranging from 0 to 80, with increments of 20.
* Values: 0, 20, 40, 60, 80
* **Legend:** Located at the top of the chart.
* Baichuan2-13B (Blue)
* LLaMA2-13B (Orange)
* Qwen-14B (Green)
* InternLM2-Math-20B (Red)
### Detailed Analysis
Here's a breakdown of each model's performance across the problem types:
* **Baichuan2-13B (Blue):**
* Generally fluctuates between 40 and 80 accuracy.
* Starts at approximately 65, dips to around 45, then rises sharply to 70.
* Peaks at around 83, then drops to 30.
* Rises again to 80, then drops to 50.
* Ends at approximately 70.
* **LLaMA2-13B (Orange):**
* Generally fluctuates between 20 and 60 accuracy.
* Starts at approximately 35, drops to 10, then rises to 40.
* Peaks at around 55, then drops to 25.
* Rises again to 60, then drops to 20.
* Ends at approximately 50.
* **Qwen-14B (Green):**
* Generally fluctuates between 0 and 40 accuracy.
* Starts at approximately 25, drops to 10, then rises to 20.
* Peaks at around 83, then drops to 10.
* Rises again to 35, then drops to 5.
* Ends at approximately 45.
* **InternLM2-Math-20B (Red):**
* Generally fluctuates between 30 and 90 accuracy.
* Starts at approximately 45, rises to 70, then drops to 35.
* Peaks at around 85, then drops to 25.
* Rises again to 75, then drops to 35.
* Ends at approximately 70.
### Key Observations
* InternLM2-Math-20B (Red) generally shows the highest accuracy, often peaking above the other models.
* Qwen-14B (Green) generally shows the lowest accuracy.
* All models exhibit significant fluctuations in accuracy across different problem types.
* There are specific problem types where all models perform poorly (e.g., around problem 10), suggesting these problems are particularly challenging.
* There are specific problem types where all models perform well (e.g., around problem 16), suggesting these problems are relatively easier.
### Interpretation
The chart demonstrates the performance of four language models on a suite of mathematical problems. The fluctuations in accuracy highlight the varying difficulty levels of different problem types and the models' strengths and weaknesses. InternLM2-Math-20B appears to be the most proficient overall, while Qwen-14B struggles in comparison. The performance variations suggest that the models may have been trained with different datasets or architectures, leading to varying levels of expertise in specific mathematical domains. Further investigation into the specific problem types and model architectures would be needed to understand the underlying reasons for these performance differences.