## Diagram Analysis: Network and Bipartite Graph Structures
### Overview
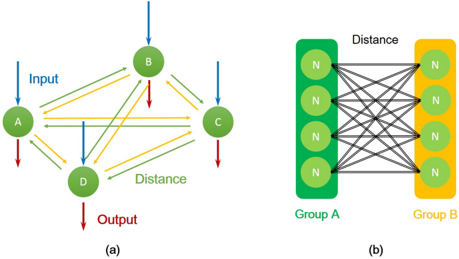
The image contains two distinct diagrams labeled (a) and (b). Diagram (a) depicts a directed network with labeled nodes and colored arrows, while diagram (b) illustrates a bipartite graph with grouped nodes and labeled connections. Both diagrams emphasize relationships ("Distance") and directional flows ("Input"/"Output").
---
### Components/Axes
#### Diagram (a)
- **Nodes**: Labeled A, B, C, D (green circles).
- **Arrows**:
- **Blue (Input)**: From A and C to B.
- **Red (Output)**: From B and D to a terminal node.
- **Yellow/Green (Distance)**: Bidirectional connections between A-B, B-C, C-D, and A-D.
- **Labels**: "Input" (top-left), "Output" (bottom-right), "Distance" (center-right).
#### Diagram (b)
- **Groups**:
- **Group A**: Left column (green nodes labeled N).
- **Group B**: Right column (yellow nodes labeled N).
- **Connections**: Black lines labeled "Distance" between all nodes in Group A and Group B.
- **Labels**: "Distance" (top-center), "Group A" (left), "Group B" (right).
---
### Detailed Analysis
#### Diagram (a)
- **Flow Structure**:
- Input nodes (A, C) feed into node B.
- Node B and D propagate signals to the Output terminal.
- Distance connections form a cyclic network (A-B-C-D-A).
- **Color Coding**:
- Input (blue) and Output (red) arrows are unidirectional.
- Distance (yellow/green) arrows are bidirectional, suggesting mutual influence.
#### Diagram (b)
- **Bipartite Graph**:
- Complete connections between Group A and Group B (all N×N links).
- Uniform "Distance" labels imply pairwise metrics between groups.
- **Node Uniformity**:
- All nodes in each group are identical (labeled N), suggesting homogeneity within groups.
---
### Key Observations
1. **Diagram (a)**:
- Node B acts as a central hub for input processing.
- Output is generated via B and D, indicating redundancy or parallel pathways.
- Distance connections form a closed loop, possibly representing feedback or interdependence.
2. **Diagram (b)**:
- All-to-all connections between groups suggest exhaustive comparison (e.g., similarity, dissimilarity).
- Absence of self-connections within groups implies no intra-group distance metrics.
---
### Interpretation
- **Diagram (a)** resembles a simplified neural network or decision-making system:
- Input nodes (A, C) contribute to a central processor (B).
- Output is derived from B and D, with distance metrics governing node interactions.
- The cyclic distance connections may model feedback loops or systemic stability.
- **Diagram (b)** aligns with clustering or similarity analysis:
- Groups A and B could represent distinct clusters or categories.
- The "Distance" labels imply a matrix of pairwise comparisons, critical for tasks like anomaly detection or classification.
- **Shared Themes**:
- Both diagrams emphasize relational metrics ("Distance") over absolute values.
- Directionality in (a) contrasts with bidirectionality in (b), reflecting different modeling approaches (sequential vs. comparative).
---
### Limitations
- No numerical data or scales are provided, limiting quantitative analysis.
- Node labels (A, B, C, D, N) are abstract; real-world interpretation requires contextual mapping.