## Line Chart: Bugfixer RL Pass Rate over Training Steps
### Overview
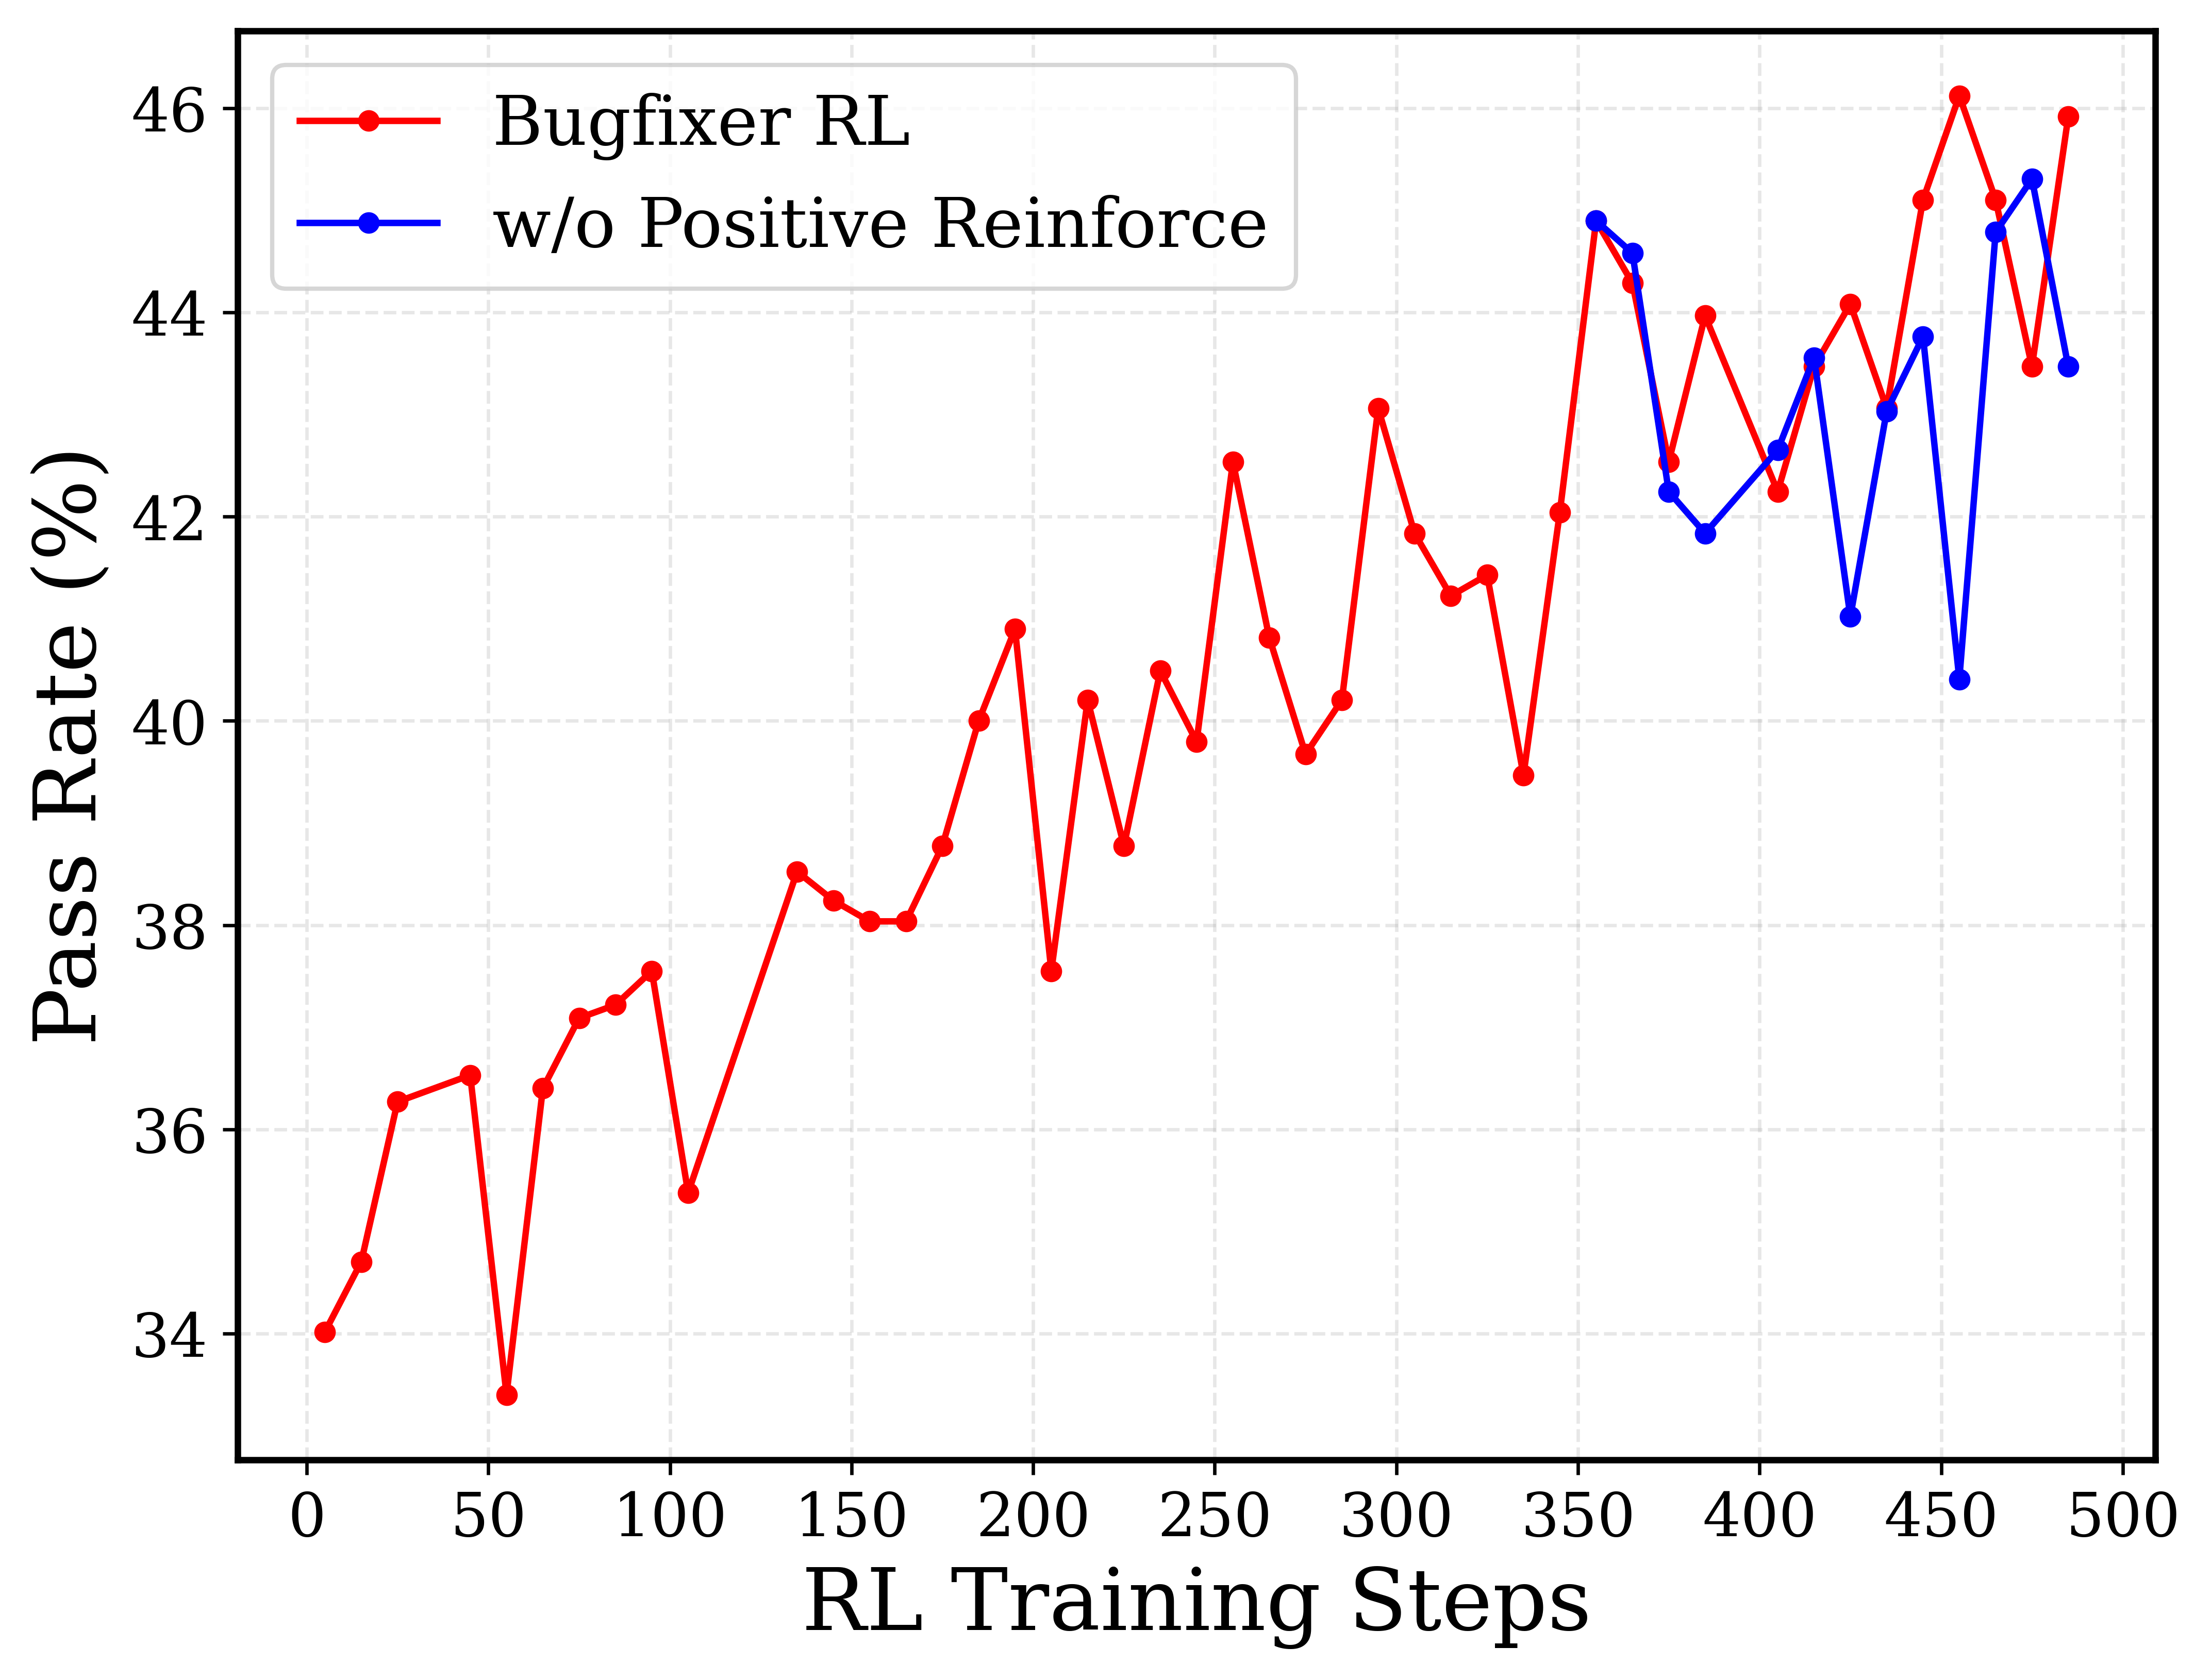
This image is a 2D line chart illustrating the performance of a reinforcement learning (RL) model, specifically measuring the "Pass Rate (%)" against "RL Training Steps". It compares a primary model ("Bugfixer RL") against an ablation or variant model ("w/o Positive Reinforce"). The chart demonstrates a generally upward, though highly volatile, trend in pass rates as training progresses.
### Components/Axes
**Spatial Grounding & Layout:**
* **Main Chart Area:** Occupies the majority of the image, featuring a light grey, dashed grid background.
* **Legend:** Positioned in the top-left corner, enclosed in a rounded rectangular border with a grey outline.
* **Y-axis:** Located on the left side.
* **X-axis:** Located at the bottom.
**Textual Information & Scales:**
* **Y-axis Label:** "Pass Rate (%)" (Rotated 90 degrees counter-clockwise).
* **Y-axis Scale:** Numeric, ranging from slightly below 34 to slightly above 46. Major tick marks and corresponding horizontal grid lines are placed at intervals of 2: `34, 36, 38, 40, 42, 44, 46`.
* **X-axis Label:** "RL Training Steps".
* **X-axis Scale:** Numeric, ranging from 0 to 500. Major tick marks and corresponding vertical grid lines are placed at intervals of 50: `0, 50, 100, 150, 200, 250, 300, 350, 400, 450, 500`.
* **Legend Content:**
* Red line with a solid red circular marker: `Bugfixer RL`
* Blue line with a solid blue circular marker: `w/o Positive Reinforce`
### Detailed Analysis
*Note: All data points extracted below are approximate (±0.5) based on visual alignment with the grid.*
#### Trend Verification: Series 1 - Bugfixer RL (Red Line)
**Visual Trend:** The red line spans the entire x-axis (from approx step 5 to 485). It exhibits a clear, overarching upward trajectory, starting near 34% and ending near 46%. However, the learning process is highly unstable, characterized by sharp peaks and deep valleys throughout the training steps.
**Extracted Data Points (Approximate X, Y coordinates):**
* (5, 34.0) - *Starting point*
* (15, 34.7)
* (25, 36.3)
* (45, 36.5)
* (55, 33.4) - *Early sharp drop*
* (65, 36.4)
* (75, 37.1)
* (85, 37.2)
* (95, 37.6)
* (105, 35.4)
* (135, 38.5)
* (145, 38.2)
* (155, 38.0)
* (165, 38.0)
* (175, 38.8)
* (185, 40.0)
* (195, 40.9)
* (205, 37.6) - *Mid-training drop*
* (215, 40.2)
* (225, 38.8)
* (235, 40.5)
* (245, 39.8)
* (255, 42.5)
* (265, 40.8)
* (275, 39.7)
* (285, 40.2)
* (295, 43.1)
* (305, 41.8)
* (315, 41.2)
* (325, 41.4)
* (335, 39.5)
* (345, 42.0)
* (355, 44.9) - *Major peak, divergence point*
* (365, 44.3)
* (375, 42.5)
* (385, 44.0)
* (395, 43.0)
* (405, 42.2)
* (415, 43.5)
* (425, 44.1)
* (435, 43.0)
* (445, 45.1)
* (455, 46.1) - *Maximum peak*
* (465, 45.1)
* (475, 43.5)
* (485, 45.9) - *Ending point*
#### Trend Verification: Series 2 - w/o Positive Reinforce (Blue Line)
**Visual Trend:** The blue line does *not* exist for the first 350 steps. It originates at step 355, sharing the exact same data point as the red line. From there, it diverges. While it generally follows the high 40s range, it exhibits extreme downward volatility compared to the red line, featuring two massive drops that the red line does not experience.
**Extracted Data Points (Approximate X, Y coordinates):**
* (355, 44.9) - *Origin point, matches red line*
* (365, 44.6)
* (375, 42.2)
* (385, 41.8)
* (405, 42.6)
* (415, 43.6)
* (425, 41.0) - *Sharp drop, significantly below red line (44.1)*
* (435, 43.0) - *Briefly converges with red line*
* (445, 43.8)
* (455, 40.4) - *Massive drop, lowest point for blue, while red is at its highest (46.1)*
* (465, 44.8)
* (475, 45.3) - *Briefly surpasses red line (43.5)*
* (485, 43.5) - *Ending point, below red line (45.9)*
### Key Observations
1. **Overall Improvement:** The primary model (Bugfixer RL) improves its pass rate from roughly 34% to 46% over 500 steps, indicating that the reinforcement learning process is generally effective over time.
2. **High Variance:** The training is not smooth. The red line shows constant "sawtooth" patterns, indicating that updates to the model frequently cause temporary regressions in performance before recovering.
3. **Late Introduction of Ablation:** The "w/o Positive Reinforce" line only begins at step 355.
4. **Severe Instability without Positive Reinforcement:** At step 455, the primary model hits its absolute peak (~46.1%), while the model without positive reinforcement hits a severe trough (~40.4%), creating the largest delta between the two models (~5.7%).
### Interpretation
* **The Nature of the Experiment:** The fact that the blue line ("w/o Positive Reinforce") starts at step 355 and perfectly intersects the red line at that exact coordinate strongly implies an ablation study methodology. The researchers likely trained the base "Bugfixer RL" model up to step 355, saved a checkpoint, and then branched the training into two parallel runs: one continuing normally, and one where the "Positive Reinforce" mechanism was turned off.
* **The Role of Positive Reinforcement:** Reading between the lines, "Positive Reinforce" acts as a stabilizing mechanism in the later stages of training. While the blue line occasionally matches or slightly beats the red line (e.g., at step 475), its primary characteristic is catastrophic forgetting or severe policy degradation (seen at steps 425 and 455). Without positive reinforcement to "anchor" good behaviors, the model is highly susceptible to sudden drops in its Pass Rate.
* **Model Application:** Given the name "Bugfixer RL" and the metric "Pass Rate (%)", this data likely represents an automated program repair or code generation model. The "Pass Rate" likely refers to the percentage of generated code patches that successfully pass a suite of unit tests. The volatility suggests that the RL environment is complex, and small changes in the model's policy can easily break previously learned bug-fixing capabilities.