## Chart: Importance Score vs. Reasoning Step
### Overview
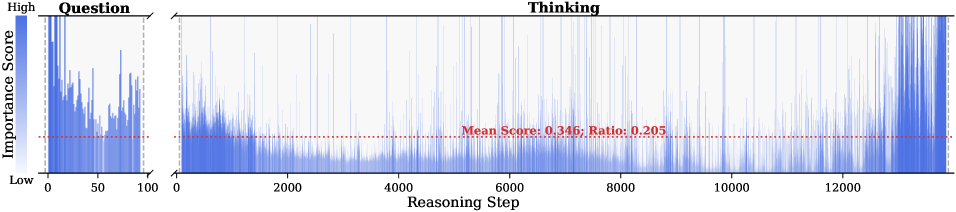
The image presents a chart illustrating the importance score over the reasoning step. The chart is divided into two sections: "Question" and "Thinking." The y-axis represents the importance score, ranging from low to high, and the x-axis represents the reasoning step. A red dotted line indicates the mean score and ratio for the "Thinking" section.
### Components/Axes
* **Title:** Thinking
* **X-axis:** Reasoning Step, ranging from 0 to approximately 13000.
* **Y-axis:** Importance Score, ranging from Low to High. A gradient bar on the left shows the color mapping, with darker blue indicating higher importance.
* **Sections:** The chart is divided into two sections: "Question" (from 0 to 100 on the x-axis) and "Thinking" (from 0 to approximately 13000 on the x-axis).
* **Mean Score Line:** A red dotted line across the "Thinking" section indicates the mean score and ratio. The text "Mean Score: 0.346; Ratio: 0.205" is displayed near the line.
### Detailed Analysis
* **Question Section:** The importance score fluctuates significantly within the "Question" section, with several peaks and valleys. The scores generally appear higher in this section compared to the "Thinking" section.
* **Thinking Section:** The importance score in the "Thinking" section starts high and then decreases rapidly before stabilizing at a lower level. There are still fluctuations, but the magnitude is smaller than in the "Question" section. The importance score increases towards the end of the "Thinking" section.
* **Mean Score:** The red dotted line representing the mean score is at approximately 0.346. The ratio is 0.205.
### Key Observations
* The "Question" section shows higher and more volatile importance scores compared to the "Thinking" section.
* The importance score decreases significantly at the beginning of the "Thinking" section.
* The importance score increases towards the end of the "Thinking" section.
* The mean score in the "Thinking" section is 0.346, and the ratio is 0.205.
### Interpretation
The chart suggests that the initial "Question" phase involves more critical and variable reasoning steps, indicated by the higher and fluctuating importance scores. As the process transitions into the "Thinking" phase, the importance of individual reasoning steps decreases and stabilizes, as shown by the lower and less volatile scores. The increase in importance score towards the end of the "Thinking" section might indicate a final stage of critical reasoning or decision-making. The mean score and ratio provide a quantitative measure of the average importance and its proportion within the "Thinking" phase.