TECHNICAL ASSET FINGERPRINT
53962ff81ad7069809bb8ae8
Click to view fullscreen
Press ESC or click to close
FOUND IN PAPERS
EXPERT: healer-alpha-free VERSION 1
RUNTIME: free/openrouter/healer-alpha
INTEL_VERIFIED
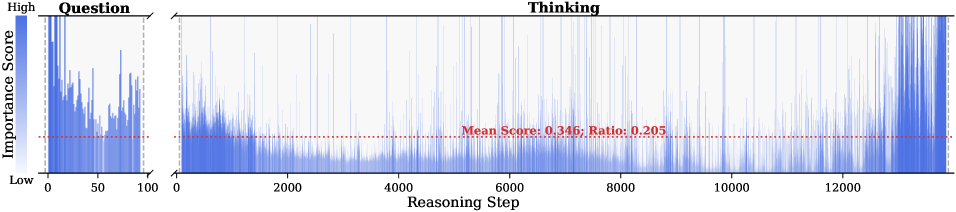
## Chart Type: Dual-Panel Bar Chart (Importance Score vs. Reasoning Step)
### Overview
The image displays a two-panel horizontal bar chart visualizing the "Importance Score" of different "Reasoning Steps" across two distinct phases: "Question" and "Thinking." The chart uses a consistent blue color for all data bars and includes a red dashed horizontal line representing a mean score across the entire dataset. The overall purpose is to compare the distribution and magnitude of importance scores between the initial questioning phase and the subsequent thinking phase of a process.
### Components/Axes
* **Y-Axis (Vertical):** Labeled **"Importance Score"**. It is a categorical axis with two labeled positions: **"High"** at the top and **"Low"** at the bottom. The axis itself is not numerical but represents a relative scale.
* **X-Axis (Horizontal):** Labeled **"Reasoning Step"**. It is a numerical axis representing the sequence of steps. The axis is split into two distinct panels with different scales.
* **Panel 1 (Left):** Titled **"Question"**. Its x-axis ranges from **0 to 100**.
* **Panel 2 (Right):** Titled **"Thinking"**. Its x-axis ranges from **0 to approximately 13,000** (the last visible major tick is 12,000, but data extends beyond).
* **Legend/Annotation:** A red dashed horizontal line runs across both panels. An annotation in red text, positioned in the center of the "Thinking" panel, reads: **"Mean Score: 0.345; Ratio: 0.205"**.
* **Data Representation:** Vertical blue bars. The height of each bar corresponds to the "Importance Score" for a specific "Reasoning Step."
### Detailed Analysis
**Panel 1: "Question" (Steps 0-100)**
* **Trend:** The data shows high variability and several prominent spikes. The importance scores are generally elevated compared to the early part of the "Thinking" phase.
* **Key Data Points & Observations:**
* The highest importance scores in the entire chart appear in the first ~10 steps of the "Question" phase, with multiple bars reaching near the "High" label.
* There is a significant cluster of high scores between steps 0-20.
* Notable spikes occur around steps 40, 60, and 80.
* The scores fluctuate rapidly, indicating that importance is highly step-dependent in this phase.
* The majority of bars in this panel appear to be above the red "Mean Score" line.
**Panel 2: "Thinking" (Steps 0-13,000+)**
* **Trend:** The data exhibits two distinct regimes. From step 0 to roughly 2,000, scores are densely packed and predominantly low. From step 2,000 onward, the distribution becomes more sparse with higher variability and more frequent high-scoring spikes.
* **Key Data Points & Observations:**
* **Phase A (Steps 0-2000):** A very dense, low-amplitude "carpet" of blue bars. Most scores here are below the red mean line. The density suggests many small, low-importance steps.
* **Phase B (Steps 2000-13000+):** The pattern shifts. While low scores persist, there are numerous isolated, tall spikes indicating steps of high importance scattered throughout the thinking process.
* The frequency of high-importance spikes appears to increase slightly in the latter half (steps 6000+).
* The final segment (steps ~12,500-13,000+) shows a dense cluster of very high importance scores, rivaling those seen in the "Question" phase.
* The red "Mean Score: 0.345" line sits in the upper portion of the dense low-score carpet but is frequently exceeded by the tall spikes.
**Cross-Reference & Spatial Grounding:**
* The red dashed "Mean Score" line is positioned at a constant y-level across both panels, visually anchored to the "Importance Score" axis.
* The annotation "Mean Score: 0.345; Ratio: 0.205" is placed in the upper-middle area of the "Thinking" panel, overlaying the data.
* The "Ratio: 0.205" likely represents the proportion of total steps (or total importance) that the "Question" phase comprises relative to the entire process (Question + Thinking). Given the step counts (100 vs. ~13,000), this ratio seems plausible for a normalized metric rather than a raw step count ratio.
### Key Observations
1. **Phase Dichotomy:** The "Question" phase is short (100 steps) but contains a high density of important steps. The "Thinking" phase is extremely long (~13,000 steps) and is dominated by a vast number of low-importance steps, punctuated by intermittent high-importance ones.
2. **Importance Distribution:** High importance is not uniformly distributed. It is concentrated at the very beginning (Question) and at sporadic, critical junctures throughout the extended Thinking process, with a notable surge at the end.
3. **The "Carpet" vs. "Spikes":** The visual contrast between the dense, low "carpet" of bars in early thinking and the isolated "spikes" later on is the most striking feature, suggesting a shift from granular, low-level processing to more significant, discrete reasoning operations.
4. **Mean Score Context:** The mean score of 0.345 serves as a benchmark. In the "Question" phase, most steps are above this mean. In the "Thinking" phase, the vast majority of steps are below it, but the high spikes pull the overall average up.
### Interpretation
This chart likely visualizes the internal attention or importance weighting of a complex reasoning system (e.g., a large language model or an AI agent) as it processes a task.
* **What it suggests:** The process begins with a highly focused "Question" phase where nearly every step is deemed important for understanding the query. This is followed by a massive "Thinking" phase. The initial part of thinking involves many fine-grained, low-importance computations (the "carpet"), possibly representing information retrieval, pattern matching, or hypothesis generation. As thinking progresses, the system identifies and commits to more significant reasoning steps (the "spikes"), which could represent key deductions, plan formulations, or evidence evaluations. The final cluster of high-importance steps may correspond to conclusion synthesis or answer formulation.
* **Relationship between elements:** The "Question" sets the stage and is uniformly critical. The "Thinking" is the exploratory engine, mostly operating at a low "importance" level but relying on crucial high-importance milestones to guide its path. The mean score provides a system-wide average, highlighting how exceptional the high-importance steps are.
* **Anomalies/Notable Trends:** The most notable trend is the phase transition from dense, low-importance processing to sparse, high-importance events. The absence of a gradual ramp-up—instead, it's a sudden shift from "carpet" to "spikes"—could indicate a threshold in the reasoning process where the system moves from exploration to exploitation or from data gathering to conclusion drawing. The final surge in importance is particularly interesting, suggesting the culmination of the thinking process is as critical as the initial question.
DECODING INTELLIGENCE...