\n
## Scatter Plot Series: Model Accuracy vs. Response Length
### Overview
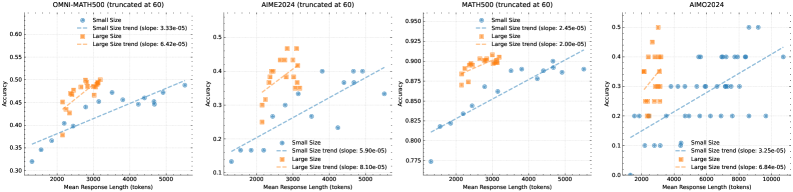
The image displays four horizontally arranged scatter plots, each analyzing the relationship between model accuracy and mean response length (in tokens) for different mathematical benchmarks. Each plot compares two model size categories: "Small Size" (blue) and "Large Size" (orange). All plots include linear trend lines for each category.
### Components/Axes
**Common Elements Across All Plots:**
* **X-Axis:** `Mean Response Length (tokens)`. The scale varies per plot but generally ranges from approximately 0 to 5000 or 10000 tokens.
* **Y-Axis:** `Accuracy`. The scale varies per plot, representing a proportion (e.g., 0.3 to 0.6).
* **Legend:** Located in the top-left corner of each plot. It defines:
* `Small Size` (Blue circle marker)
* `Large Size` (Orange circle marker)
* `Small Size trend (slope: [value])` (Blue dashed line)
* `Large Size trend (slope: [value])` (Orange dashed line)
**Individual Plot Details:**
1. **Plot 1 (Leftmost):**
* **Title:** `OMNI-MATH500 (truncated at 60)`
* **X-Axis Range:** ~0 to 5500 tokens.
* **Y-Axis Range:** 0.30 to 0.60.
* **Trend Line Slopes:**
* Small Size: `3.33e-05`
* Large Size: `6.42e-05`
2. **Plot 2 (Center-Left):**
* **Title:** `AIME2024 (truncated at 60)`
* **X-Axis Range:** ~0 to 5500 tokens.
* **Y-Axis Range:** 0.10 to 0.50.
* **Trend Line Slopes:**
* Small Size: `5.90e-05`
* Large Size: `8.10e-05`
3. **Plot 3 (Center-Right):**
* **Title:** `MATH500 (truncated at 60)`
* **X-Axis Range:** ~0 to 5500 tokens.
* **Y-Axis Range:** 0.775 to 0.850.
* **Trend Line Slopes:**
* Small Size: `2.43e-05`
* Large Size: `2.00e-05`
4. **Plot 4 (Rightmost):**
* **Title:** `AIMC2024`
* **X-Axis Range:** 0 to 10000 tokens.
* **Y-Axis Range:** 0.0 to 0.5.
* **Trend Line Slopes:**
* Small Size: `3.25e-05`
* Large Size: `8.84e-05`
### Detailed Analysis
**Data Point Distribution & Trends:**
* **OMNI-MATH500:** Small Size models (blue) cluster between 0.30-0.50 accuracy and 0-5000 tokens. Large Size models (orange) cluster higher, between 0.40-0.55 accuracy and 1000-3000 tokens. Both trends are positive; the Large Size trend line is steeper (slope: 6.42e-05 vs. 3.33e-05).
* **AIME2024:** Small Size models show a wide spread from 0.10-0.45 accuracy. Large Size models are concentrated in a higher accuracy band (0.30-0.50) with response lengths mostly under 3000 tokens. Both trends are positive, with the Large Size slope being notably steeper (8.10e-05 vs. 5.90e-05).
* **MATH500:** This plot has a much narrower, higher accuracy range (0.775-0.850). Small Size models are spread across the full length range. Large Size models are tightly clustered at the higher end of accuracy (0.82-0.85) and moderate lengths (1000-3000 tokens). Both trends are positive but shallow; here, the Small Size trend is slightly steeper (2.43e-05 vs. 2.00e-05).
* **AIMC2024:** Data points are more sparse. Small Size models are scattered across low-to-mid accuracy (0.0-0.4). Large Size models form a distinct cluster at higher accuracy (0.3-0.5) and moderate lengths (1000-4000 tokens). Both trends are positive, with the Large Size slope being significantly steeper (8.84e-05 vs. 3.25e-05).
### Key Observations
1. **Consistent Positive Correlation:** In all four benchmarks, there is a positive correlation between mean response length and accuracy for both model sizes.
2. **Model Size Advantage:** Large Size models (orange) consistently achieve higher accuracy than Small Size models (blue) at comparable response lengths across all benchmarks.
3. **Slope Comparison:** The trend line for Large Size models is steeper than for Small Size models in three of the four plots (OMNI-MATH500, AIME2024, AIMC2024), suggesting accuracy may scale more favorably with increased length for larger models. MATH500 is the exception.
4. **Benchmark Difficulty:** The accuracy ranges suggest varying benchmark difficulty. MATH500 shows the highest overall accuracy (0.775-0.850), while AIME2024 and AIMC2024 show lower accuracy ceilings, indicating they may be more challenging.
5. **Data Truncation:** The titles for the first three plots note "(truncated at 60)", which likely means the underlying evaluation was limited to problems with up to 60 steps or a similar constraint, potentially affecting the maximum achievable response length and accuracy.
### Interpretation
The data suggests a fundamental trade-off or relationship in language model performance on mathematical tasks: generating longer, more detailed responses is associated with higher accuracy. This could indicate that models which "think more" (produce more tokens) arrive at better solutions.
The consistent performance gap between Large and Small Size models reinforces the understanding that model scale is a primary driver of capability. Furthermore, the generally steeper slopes for Large models imply they may be more efficient at converting additional computational effort (longer responses) into accuracy gains.
The variation across benchmarks is insightful. The high, clustered accuracy on MATH500 suggests it may be a benchmark where models have reached a performance plateau, or it tests a more uniform skill set. In contrast, the wider spreads and lower ceilings on AIME2024 and AIMC2024 indicate these benchmarks likely contain more diverse or difficult problems that better differentiate model capabilities and expose the benefits of both scale and increased reasoning length.
**Notable Anomaly:** The MATH500 plot is an outlier in two ways: it has the highest accuracy range and is the only plot where the Small Size trend slope is marginally steeper than the Large Size slope. This could be due to a ceiling effect, where Large Size models are already near-maximal performance, leaving less room for accuracy to improve with length.