\n
## Scatter Plot: High School Statistics
### Overview
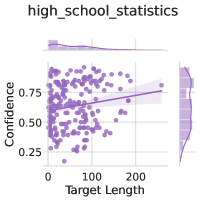
The image presents a scatter plot visualizing the relationship between "Target Length" and "Confidence". A regression line is overlaid on the scatter points, along with a shaded region representing the confidence interval around the regression line. Marginal distributions (histograms) are displayed along the top and right edges of the plot, showing the distributions of "Target Length" and "Confidence" respectively.
### Components/Axes
* **Title:** "high\_school\_statistics" (top-center)
* **X-axis:** "Target Length" (bottom-center), ranging from approximately 0 to 220.
* **Y-axis:** "Confidence" (left-center), ranging from approximately 0.2 to 0.8.
* **Scatter Points:** Numerous purple dots representing individual data points.
* **Regression Line:** A purple line representing the linear relationship between "Target Length" and "Confidence".
* **Confidence Interval:** A light purple shaded region around the regression line, indicating the uncertainty in the estimated relationship.
* **Marginal Distribution (Top):** A histogram showing the distribution of "Target Length".
* **Marginal Distribution (Right):** A histogram showing the distribution of "Confidence".
### Detailed Analysis
The scatter plot shows a generally positive, but weak, correlation between "Target Length" and "Confidence".
* **Scatter Points Trend:** The points are scattered, with a slight tendency for "Confidence" to increase as "Target Length" increases. There is a large spread of data points around the regression line.
* **Regression Line Trend:** The regression line slopes upward, indicating a positive relationship. The slope appears to be relatively small.
* **Confidence Interval:** The confidence interval is relatively wide, suggesting a high degree of uncertainty in the estimated relationship.
* **Target Length Distribution:** The distribution of "Target Length" is skewed to the right, with a concentration of values near 0 and a tail extending towards higher values. The peak of the distribution is around 0-20.
* **Confidence Distribution:** The distribution of "Confidence" appears to be roughly uniform between 0.2 and 0.8, with a slight concentration of values around 0.6.
Due to the scatter plot's nature, precise numerical values cannot be extracted without access to the underlying data. However, we can approximate some points:
* At "Target Length" = 0, "Confidence" ranges from approximately 0.3 to 0.7, with a concentration around 0.6.
* At "Target Length" = 100, "Confidence" ranges from approximately 0.4 to 0.8, with a concentration around 0.65.
* At "Target Length" = 200, "Confidence" ranges from approximately 0.5 to 0.8, with a concentration around 0.7.
### Key Observations
* The relationship between "Target Length" and "Confidence" is weak and noisy.
* The confidence interval is wide, indicating a high degree of uncertainty.
* The distribution of "Target Length" is skewed, while the distribution of "Confidence" is relatively uniform.
* There are no obvious outliers.
### Interpretation
The data suggests a slight positive association between "Target Length" and "Confidence", but the relationship is not strong enough to make definitive conclusions. The wide confidence interval indicates that the observed relationship could be due to chance. The skewed distribution of "Target Length" suggests that most observations have relatively short target lengths, while the uniform distribution of "Confidence" suggests that confidence levels are relatively consistent across different target lengths.
The "high\_school\_statistics" title suggests that this data may relate to some aspect of high school performance or assessment. "Target Length" could refer to the length of an essay, a test, or some other task, while "Confidence" could refer to a student's self-reported confidence level or a teacher's assessment of a student's confidence. The weak correlation suggests that there is little relationship between the length of a task and a student's confidence level. Further investigation would be needed to understand the specific context of this data and to determine the underlying factors that influence confidence levels.