\n
## Line Chart: Reward vs. Timesteps for Baseline Algorithms
### Overview
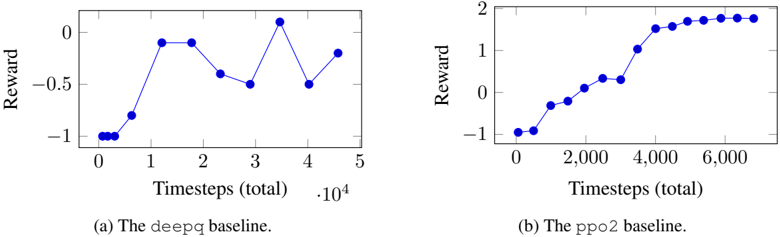
The image presents two line charts comparing the reward achieved by two reinforcement learning algorithms, `deepq` and `ppo2`, over time (measured in timesteps). Both charts plot Reward (y-axis) against Timesteps (total) (x-axis).
### Components/Axes
* **Chart 1 (Left):**
* **Title:** (a) The deepq baseline.
* **X-axis Label:** Timesteps (total)
* **X-axis Scale:** 0 to 5, with a secondary scale indicating `.10^4` at the end.
* **Y-axis Label:** Reward
* **Y-axis Scale:** -1 to 0.
* **Chart 2 (Right):**
* **Title:** (b) The ppo2 baseline.
* **X-axis Label:** Timesteps (total)
* **X-axis Scale:** 0 to 6,000.
* **Y-axis Label:** Reward
* **Y-axis Scale:** -1 to 2.
* **Data Series:** Both charts have a single data series represented by blue circles connected by a blue line.
### Detailed Analysis or Content Details
**Chart 1: deepq baseline**
The line representing the `deepq` baseline shows a fluctuating reward pattern. The line initially slopes upward, then fluctuates.
* Timestep 0: Reward ≈ -0.95
* Timestep 0.5: Reward ≈ -0.8
* Timestep 1: Reward ≈ -0.3
* Timestep 2: Reward ≈ -0.6
* Timestep 3: Reward ≈ 0.2
* Timestep 4: Reward ≈ -0.5
* Timestep 5: Reward ≈ -0.2
**Chart 2: ppo2 baseline**
The line representing the `ppo2` baseline shows a consistently increasing reward pattern. The line slopes upward throughout the entire duration.
* Timestep 0: Reward ≈ -1.0
* Timestep 1,000: Reward ≈ -0.2
* Timestep 2,000: Reward ≈ 0.2
* Timestep 3,000: Reward ≈ 0.8
* Timestep 4,000: Reward ≈ 1.4
* Timestep 5,000: Reward ≈ 1.8
* Timestep 6,000: Reward ≈ 1.9
### Key Observations
* The `ppo2` baseline consistently achieves higher rewards than the `deepq` baseline.
* The `deepq` baseline exhibits significant fluctuations in reward, indicating instability in the learning process.
* The `ppo2` baseline demonstrates a clear upward trend, suggesting stable and effective learning.
* The `deepq` baseline appears to plateau at a lower reward level.
### Interpretation
The data suggests that the `ppo2` algorithm is more effective at learning the task than the `deepq` algorithm, as evidenced by its consistently higher and increasing reward. The fluctuations observed in the `deepq` baseline may indicate sensitivity to hyperparameters or the stochastic nature of the environment. The consistent upward trend of the `ppo2` baseline suggests a more robust and stable learning process. The difference in performance highlights the importance of algorithm selection in reinforcement learning tasks. The `deepq` baseline's performance is relatively low and unstable, while the `ppo2` baseline demonstrates a clear ability to learn and improve over time. This comparison provides valuable insights into the strengths and weaknesses of each algorithm in this specific context.