\n
## Chart: NMSE over Time for Different Methods
### Overview
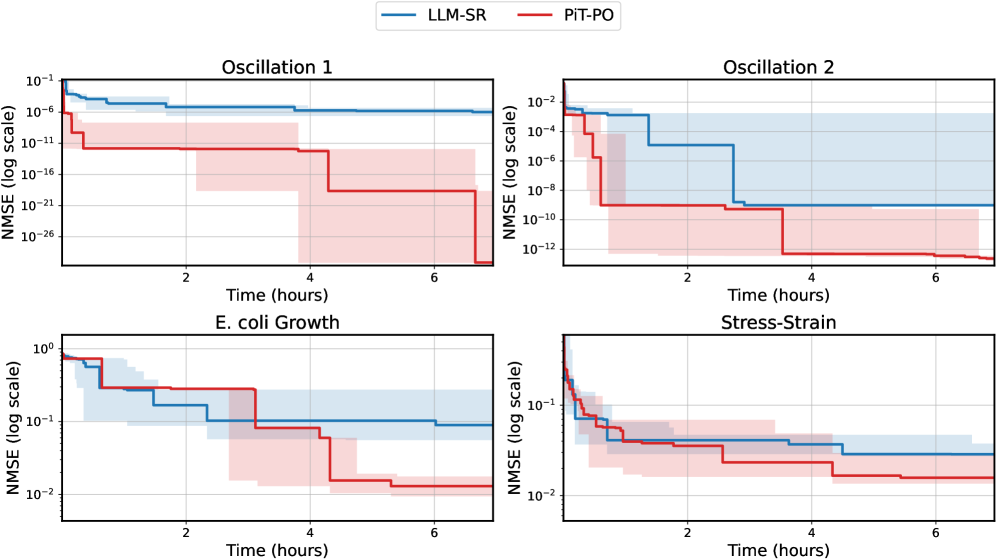
The image presents four line charts, each depicting the Normalized Mean Squared Error (NMSE) on a logarithmic scale against Time (in hours). Two methods, LLM-SR (blue) and PIT-PO (red), are compared across four different scenarios: Oscillation 1, Oscillation 2, E. coli Growth, and Stress-Strain. Each chart includes shaded regions representing uncertainty around the respective lines.
### Components/Axes
* **X-axis:** Time (hours), ranging from 0 to 6 hours.
* **Y-axis:** NMSE (log scale), ranging from 10<sup>-26</sup> to 10<sup>2</sup>.
* **Lines:**
* LLM-SR (blue)
* PIT-PO (red)
* **Shaded Regions:** Represent uncertainty around each line. The shading is light blue for LLM-SR and light red for PIT-PO.
* **Titles:** Each subplot has a title indicating the scenario: "Oscillation 1", "Oscillation 2", "E. coli Growth", "Stress-Strain".
* **Legend:** Located in the top-right corner, labeling the lines as "LLM-SR" and "PIT-PO".
### Detailed Analysis or Content Details
**Oscillation 1 (Top-Left):**
* LLM-SR (blue): Starts at approximately 10<sup>-1</sup> NMSE and decreases to approximately 10<sup>-26</sup> NMSE by 6 hours. The line is relatively flat between 2 and 4 hours.
* PIT-PO (red): Starts at approximately 10<sup>-1</sup> NMSE and decreases to approximately 10<sup>-16</sup> NMSE by 6 hours. The line has a step-wise decrease, remaining constant for periods before dropping.
**Oscillation 2 (Top-Right):**
* LLM-SR (blue): Starts at approximately 10<sup>-2</sup> NMSE and decreases to approximately 10<sup>-12</sup> NMSE by 6 hours. The line is relatively flat between 2 and 4 hours.
* PIT-PO (red): Starts at approximately 10<sup>-4</sup> NMSE and decreases to approximately 10<sup>-12</sup> NMSE by 6 hours. The line has a step-wise decrease, remaining constant for periods before dropping.
**E. coli Growth (Bottom-Left):**
* LLM-SR (blue): Starts at approximately 10<sup>0</sup> NMSE and decreases to approximately 10<sup>-2</sup> NMSE by 6 hours. The line is relatively flat between 2 and 4 hours.
* PIT-PO (red): Starts at approximately 10<sup>0</sup> NMSE and decreases to approximately 10<sup>-2</sup> NMSE by 6 hours. The line has a step-wise decrease, remaining constant for periods before dropping.
**Stress-Strain (Bottom-Right):**
* LLM-SR (blue): Starts at approximately 10<sup>1</sup> NMSE and decreases to approximately 10<sup>-1</sup> NMSE by 6 hours. The line is relatively flat between 2 and 4 hours.
* PIT-PO (red): Starts at approximately 10<sup>1</sup> NMSE and decreases to approximately 10<sup>-1</sup> NMSE by 6 hours. The line has a step-wise decrease, remaining constant for periods before dropping.
### Key Observations
* In all four scenarios, both LLM-SR and PIT-PO show a decreasing trend in NMSE over time, indicating improved performance as time progresses.
* LLM-SR generally achieves lower NMSE values than PIT-PO in all scenarios, especially after 4 hours.
* PIT-PO exhibits a step-wise decrease in NMSE, while LLM-SR shows a smoother, more continuous decrease.
* The uncertainty regions (shaded areas) are relatively wide, particularly in the early stages of each scenario, indicating higher variability in the NMSE estimates.
### Interpretation
The charts demonstrate the performance of two methods, LLM-SR and PIT-PO, in predicting or modeling different dynamic systems. The decreasing NMSE values suggest that both methods improve their accuracy over time. LLM-SR consistently outperforms PIT-PO across all scenarios, suggesting it is a more effective method for these types of problems. The step-wise nature of PIT-PO's NMSE reduction might indicate a discrete update or adjustment process within the method. The wide uncertainty regions early on suggest that initial predictions are less reliable, but become more stable as time progresses and more data is available. The different scenarios (Oscillation, E. coli Growth, Stress-Strain) represent diverse applications, and the consistent outperformance of LLM-SR suggests its robustness and generalizability. The logarithmic scale emphasizes the significant reduction in error achieved by both methods, even if the absolute error remains non-negligible.