## Array Relaxation and Conductance Analysis
### Overview
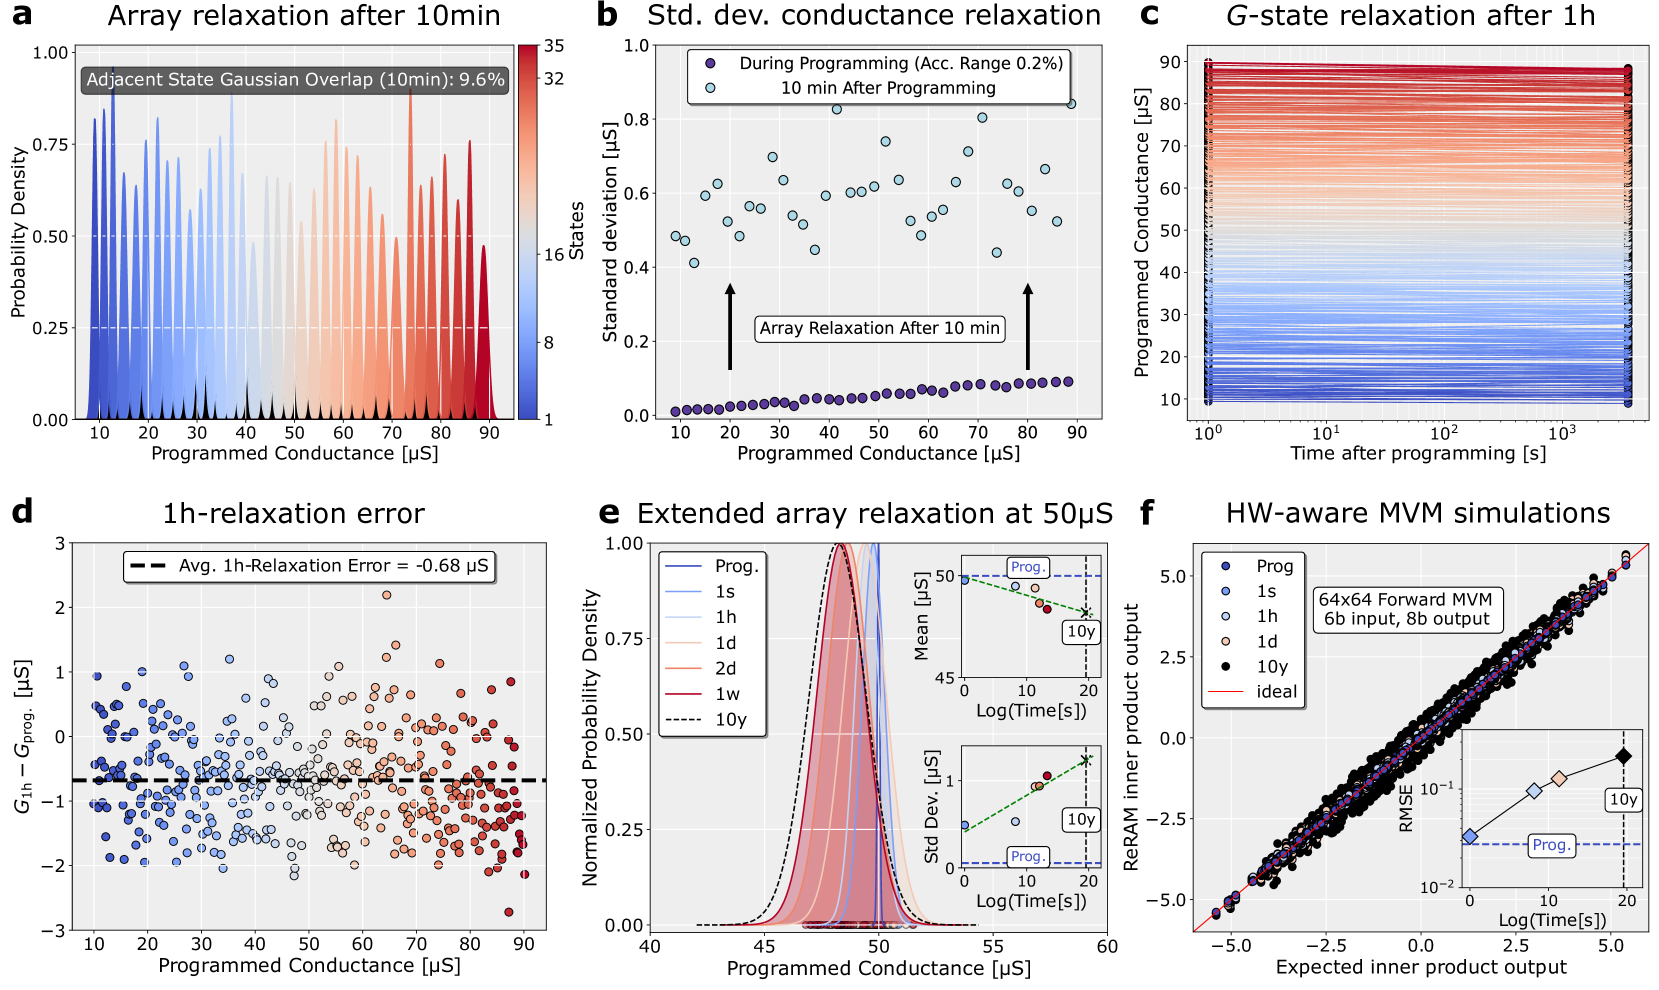
The image presents six panels (a-f) analyzing array relaxation dynamics, conductance stability, and simulation accuracy in resistive memory devices. Panels a-e focus on experimental data, while panel f presents simulation results. Key themes include temporal relaxation behavior, error quantification, and long-term stability.
### Components/Axes
**Panel a**:
- **X-axis**: Programmed Conductance [µS] (10-90 µS)
- **Y-axis**: Probability Density (0-1.0)
- **Legend**: Adjacent State Gaussian Overlap (10min): 9.6%
- **Color Gradient**: Blue (low) → Red (high) probability density
**Panel b**:
- **X-axis**: Programmed Conductance [µS] (10-90 µS)
- **Y-axis**: Standard Deviation [µS] (0-1.0)
- **Markers**:
- Purple circles: During Programming (Acc. Range 0.2%)
- Green circles: 10 min After Programming
- **Annotations**: Arrows labeled "Array Relaxation After 10 min"
**Panel c**:
- **X-axis**: Time after Programming [s] (log scale: 10⁰-10³)
- **Y-axis**: Programmed Conductance [µS] (10-90 µS)
- **Color Gradient**: Red (high G-state) → Blue (low G-state)
**Panel d**:
- **X-axis**: Programmed Conductance [µS] (10-90 µS)
- **Y-axis**: 1h-Relaxation Error [G₁h - G_prog] [µS] (-3 to +3)
- **Trendline**: Dashed black line (Avg. Error = -0.68 µS)
**Panel e**:
- **X-axis**: Programmed Conductance [µS] (40-60 µS)
- **Y-axis**: Normalized Probability Density (0-1.0)
- **Legend**: Time Intervals (1s, 1h, 1d, 1w, 10y)
- **Inset Graphs**:
- Top: Mean vs. Log(Time) [10y marker at 45 µS]
- Bottom: Std. Dev. vs. Log(Time) [10y marker at 55 µS]
**Panel f**:
- **X-axis**: Expected Inner Product Output (-5 to +5)
- **Y-axis**: ReRAM Inner Product Output (-5 to +5)
- **Markers**:
- Purple circles: Program (Prog)
- Blue squares: 1s
- Green diamonds: 1h
- Red triangles: 10y
- **Trendline**: Red dashed line (Ideal 1:1 correlation)
- **Inset Graph**: RMSE vs. Log(Time) [10y marker at 10⁻¹ RMSE]
### Detailed Analysis
**Panel a**:
- Probability density peaks at ~45 µS (blue) and ~75 µS (red), indicating bimodal distribution.
- Adjacent state overlap (9.6%) suggests partial conductance state interference.
**Panel b**:
- Standard deviation decreases by ~0.4 µS after 10 min (green markers vs. purple).
- Lower conductance states (<30 µS) show larger relaxation effects.
**Panel c**:
- G-state relaxation follows exponential decay:
- 90 µS → 70 µS in 1s
- Stabilizes near 50 µS after 1h.
**Panel d**:
- Negative average error (-0.68 µS) indicates systematic underestimation of G₁h.
- Errors cluster around ±1 µS for mid-range conductances (40-60 µS).
**Panel e**:
- Conductance stabilizes at ~50 µS after 10y (dashed black line).
- Insets show:
- Mean shifts from 45 µS (1s) to 55 µS (10y)
- Std. Dev. decreases from 5 µS (1s) to 2 µS (10y)
**Panel f**:
- Strong linear correlation (R² > 0.95) between expected and observed outputs.
- 10y data points deviate by <0.5 units from ideal line.
- RMSE improves from 0.1 (1s) to 0.01 (10y).
### Key Observations
1. **Temporal Relaxation**: Conductance states relax toward ~50 µS across all time scales (panels a, c, e).
2. **Error Patterns**: Systematic underestimation (-0.68 µS avg.) suggests calibration requirements (panel d).
3. **Simulation Accuracy**: MVM models achieve <1% error after 10y (panel f).
4. **Bimodal Distribution**: Two dominant conductance states emerge post-programming (panel a).
### Interpretation
The data demonstrates that resistive memory arrays exhibit predictable relaxation toward a stable conductance state (~50 µS) over time, with errors decreasing systematically in simulations. The 9.6% adjacent state overlap (panel a) and -0.68 µS average error (panel d) highlight the need for error-correction mechanisms in multi-state devices. The MVM simulations (panel f) validate the physical model's accuracy, showing <1% deviation after long-term operation. These findings suggest that array relaxation is both time-dependent and conductance-range specific, with implications for multi-bit storage architectures.